DensityDesign Lab · Politecnico di Milano · Data design · 2022 — 23
A Highway to Greenness.
How car brands make their adverts look green, without saying it.
01Overview
90 fleeting adverts, turned into countable evidence.
At Politecnico di Milano’s DensityDesign Lab, our team of seven asked how car brands make their models look green on YouTube. We studied 90 adverts and turned the answer into a 60-page report and Automotifs, a website of supercuts and video collages.
- My role
- Research, data storytelling and video
- Timeline
- Autumn 2022 — February 2023
- Team
- Haleh Nobar, Andrea Benedetto, Simone Cerea, Camilla Guerci, Surabhi Gupta, Alessandro Pedriali, Yousef Taffal
- Tools
- Premiere Pro, After Effects, YouTube Data Tools, RAWGraphs, OCR, Read-o-Meter, computer vision
- Status
- Course project; report and website published
02The problem
Car brands are accused of greenwashing, yet their adverts rarely make bold green claims. They show it, in landscapes, stories and fine print too fast to read.
We slowed 90 adverts down, 30 each for petrol, hybrid and electric, and read every one three times, each time with a new question.
Where is the car shown?
How is its story told?
How is it described?
03The outcome
Few bold claims, but a consistent set of quiet patterns.
We documented this in a research report written for an expert audience, and in Automotifs, a website that cuts the patterns out of their adverts so drivers can see them in seconds.
At a glance
04Five patterns, counted
Greenery fills half or more of every engine’s adverts. The four narrative strategies are rarer, yet no engine is free of them.
Adverts showing each pattern, out of 30 per engine. Counts from the report.
05What we found
Thirteen findings, each traceable to its data.
Three questions, each answered with its own method. For each one: what we saw, then its most consequential finding, as the report’s conclusion weighs them. The other ten follow.
Question 01 · Environments · 4 findings
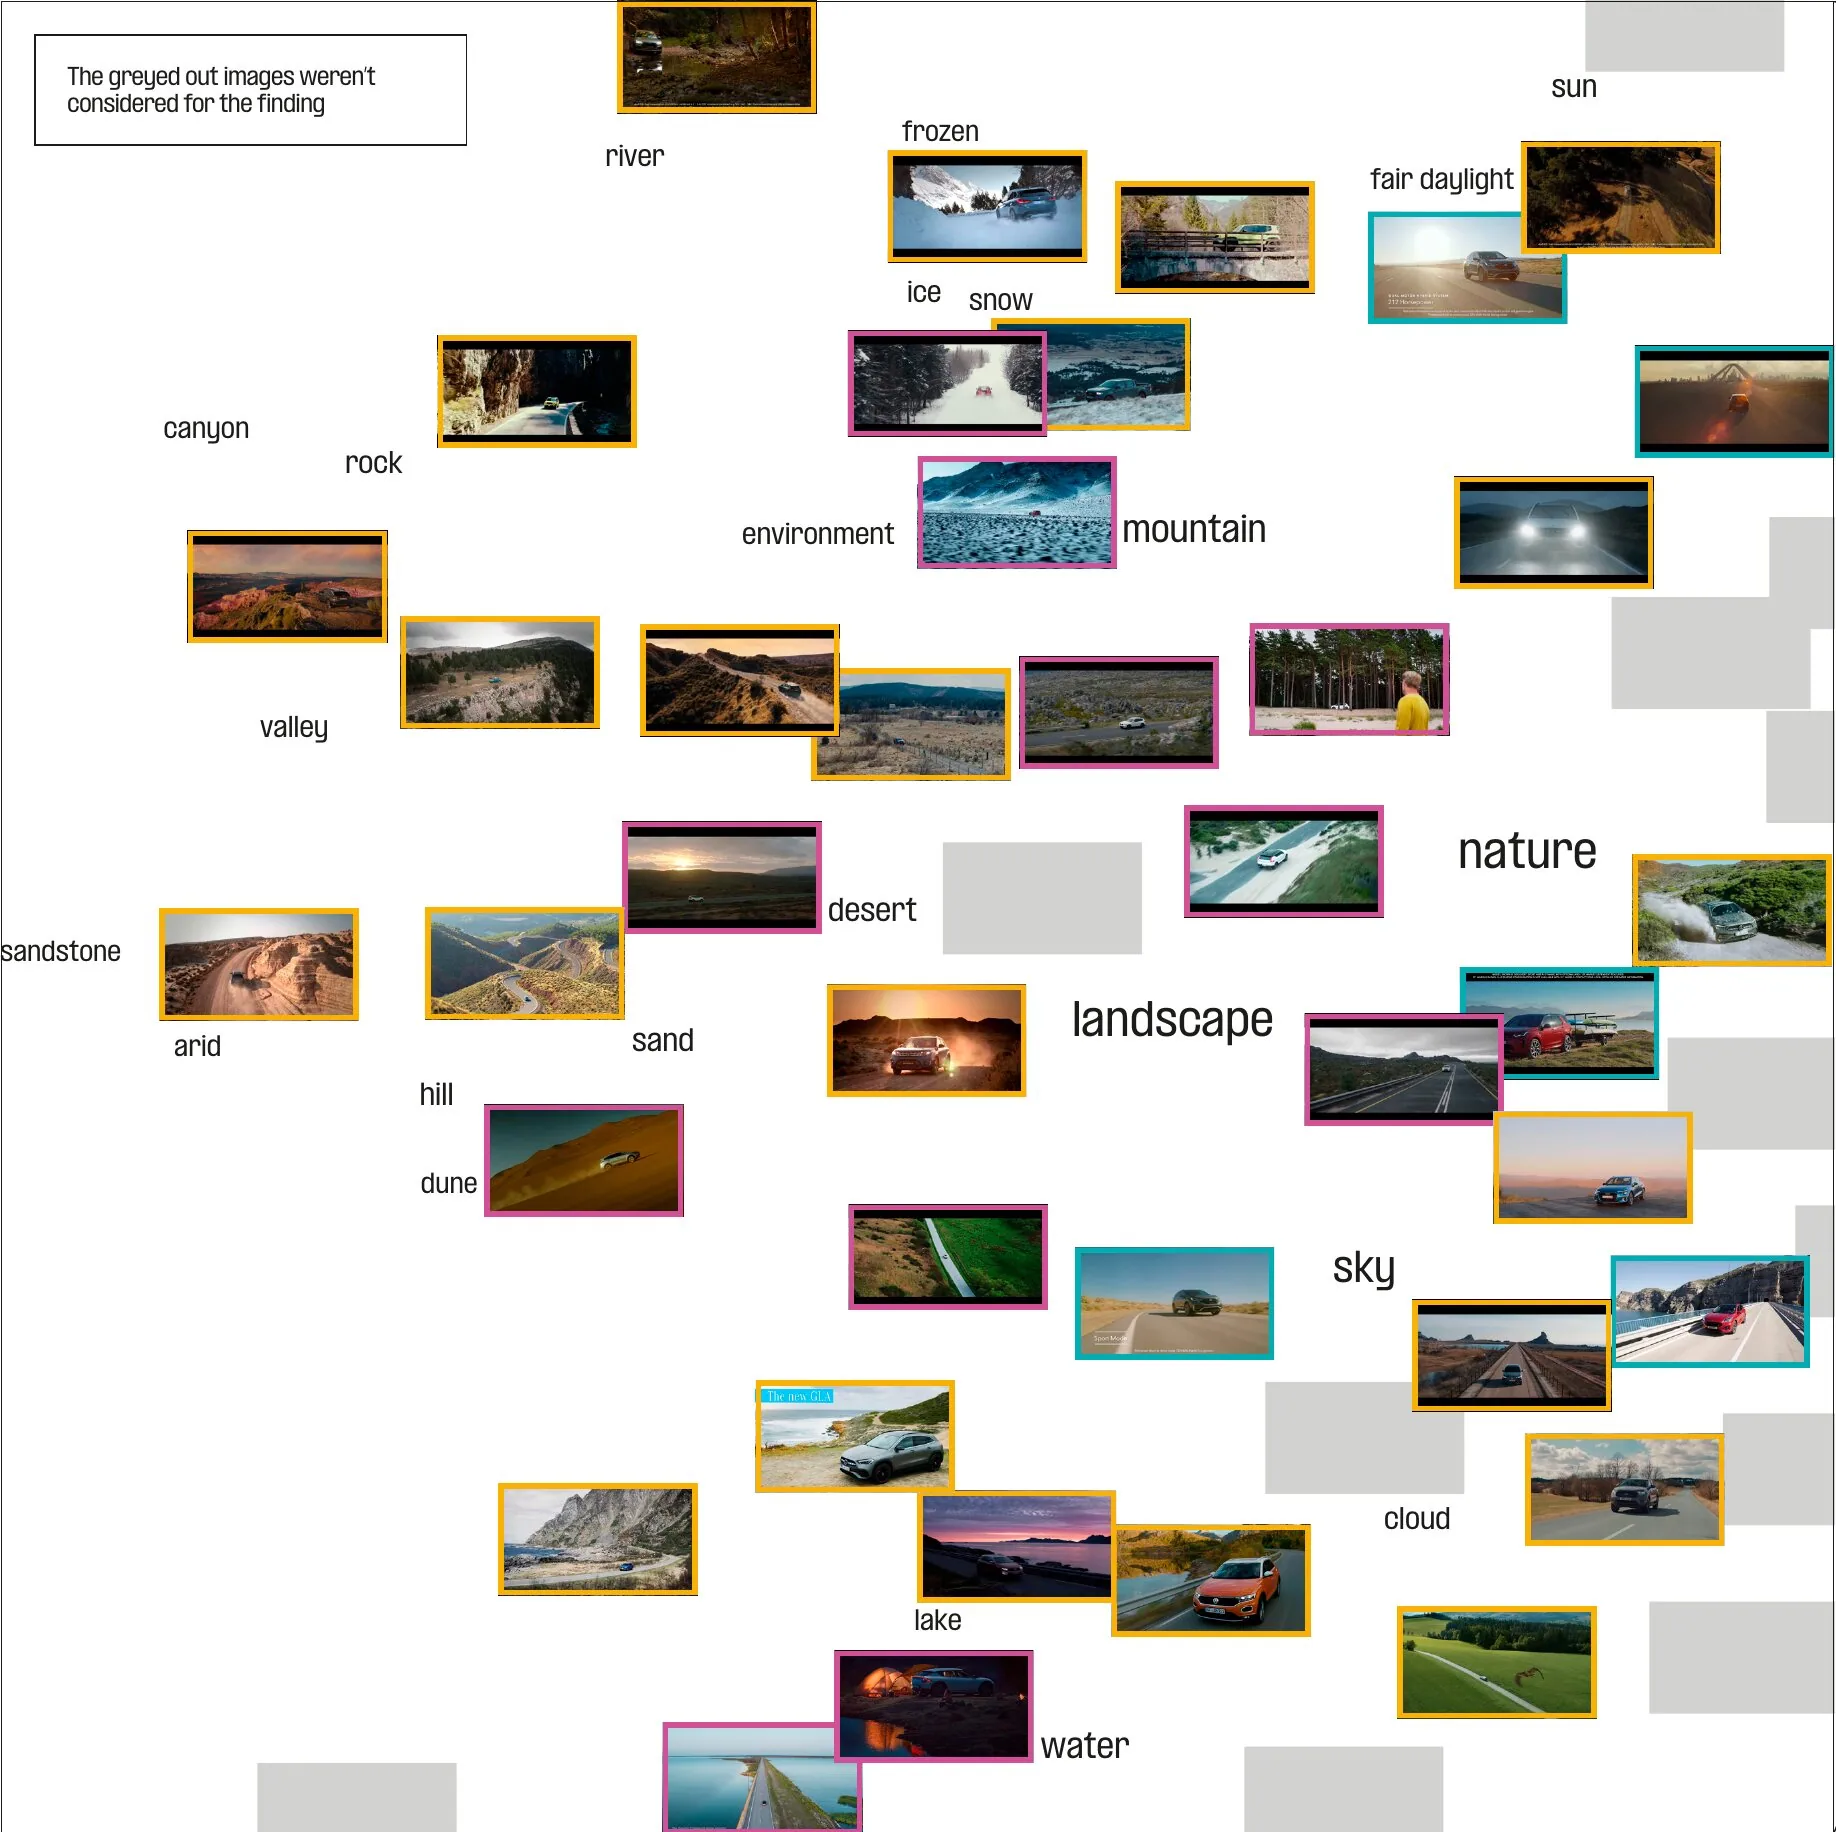
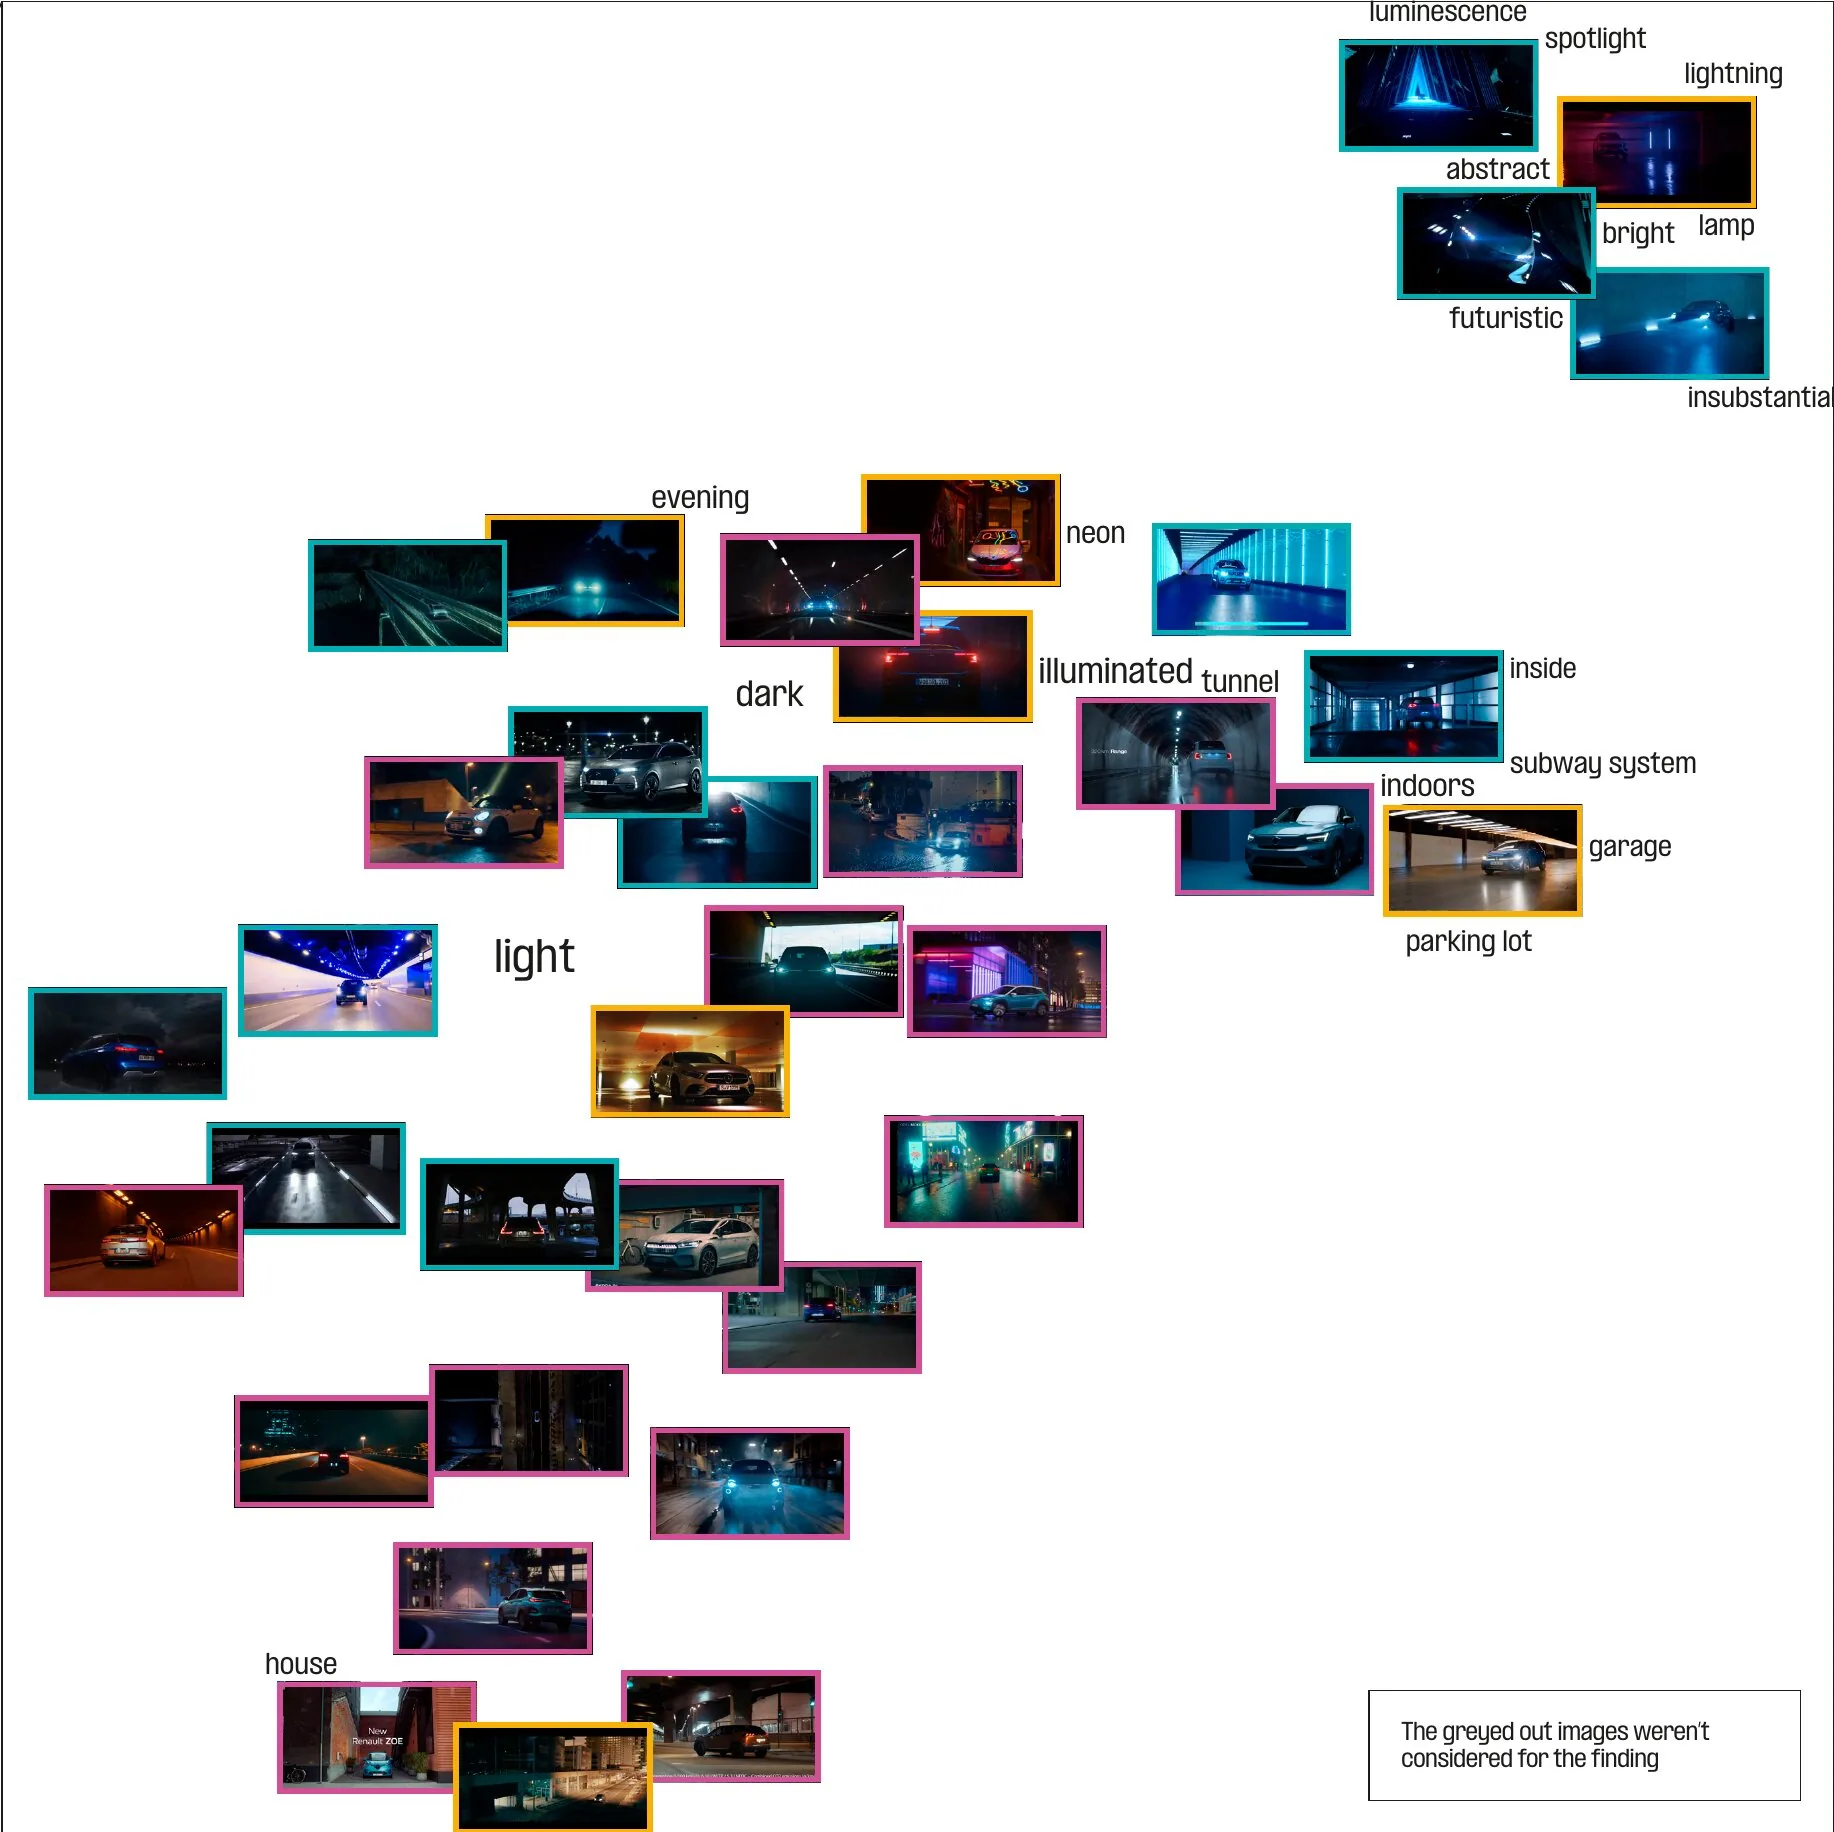
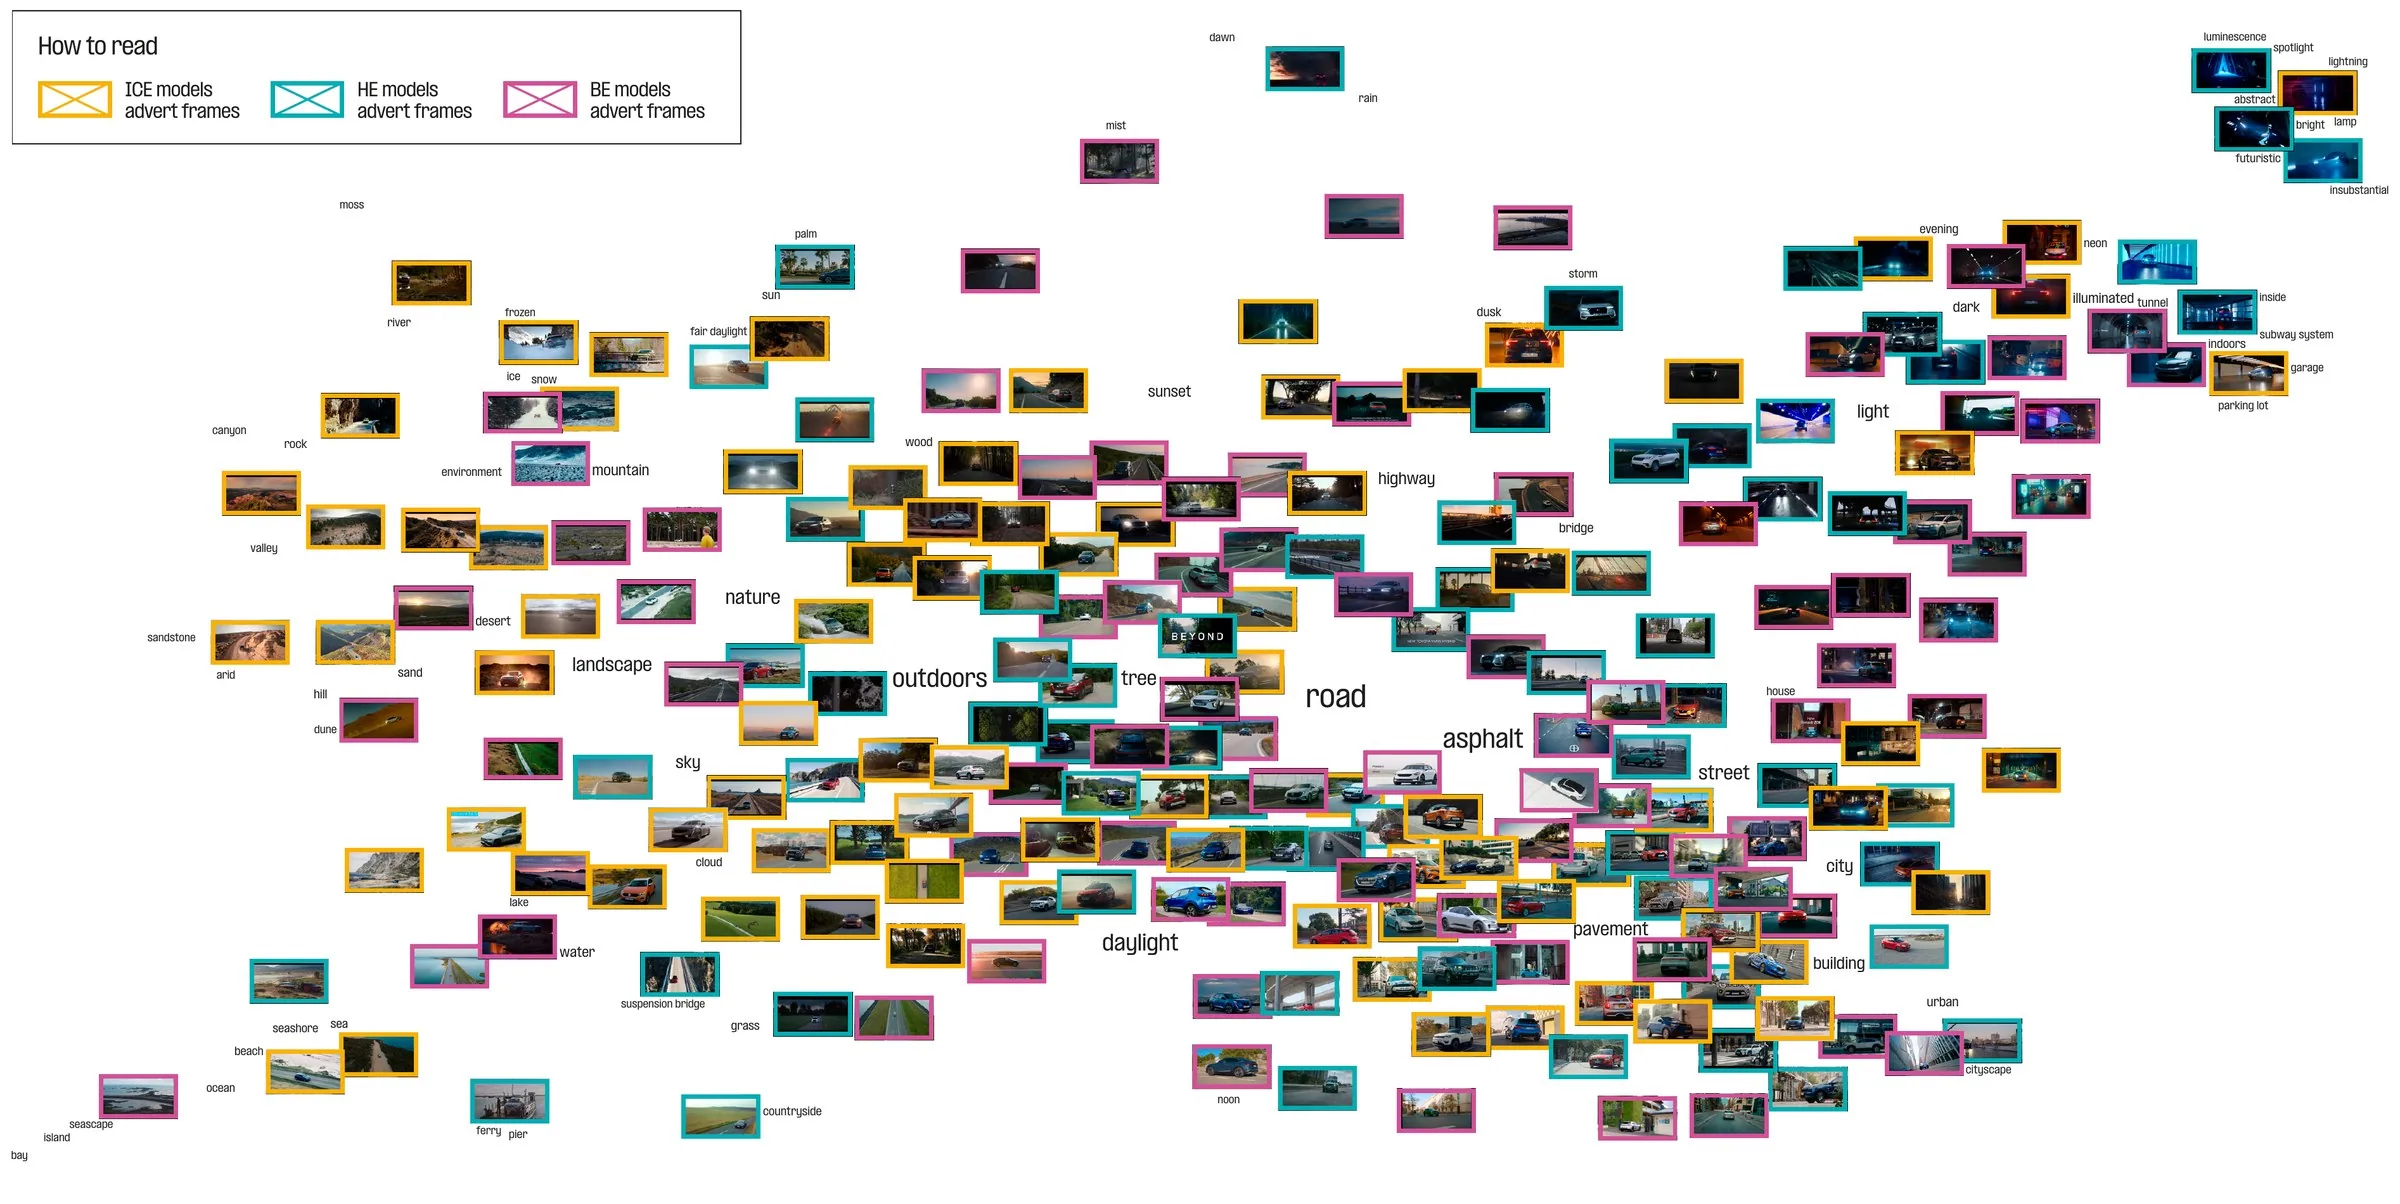
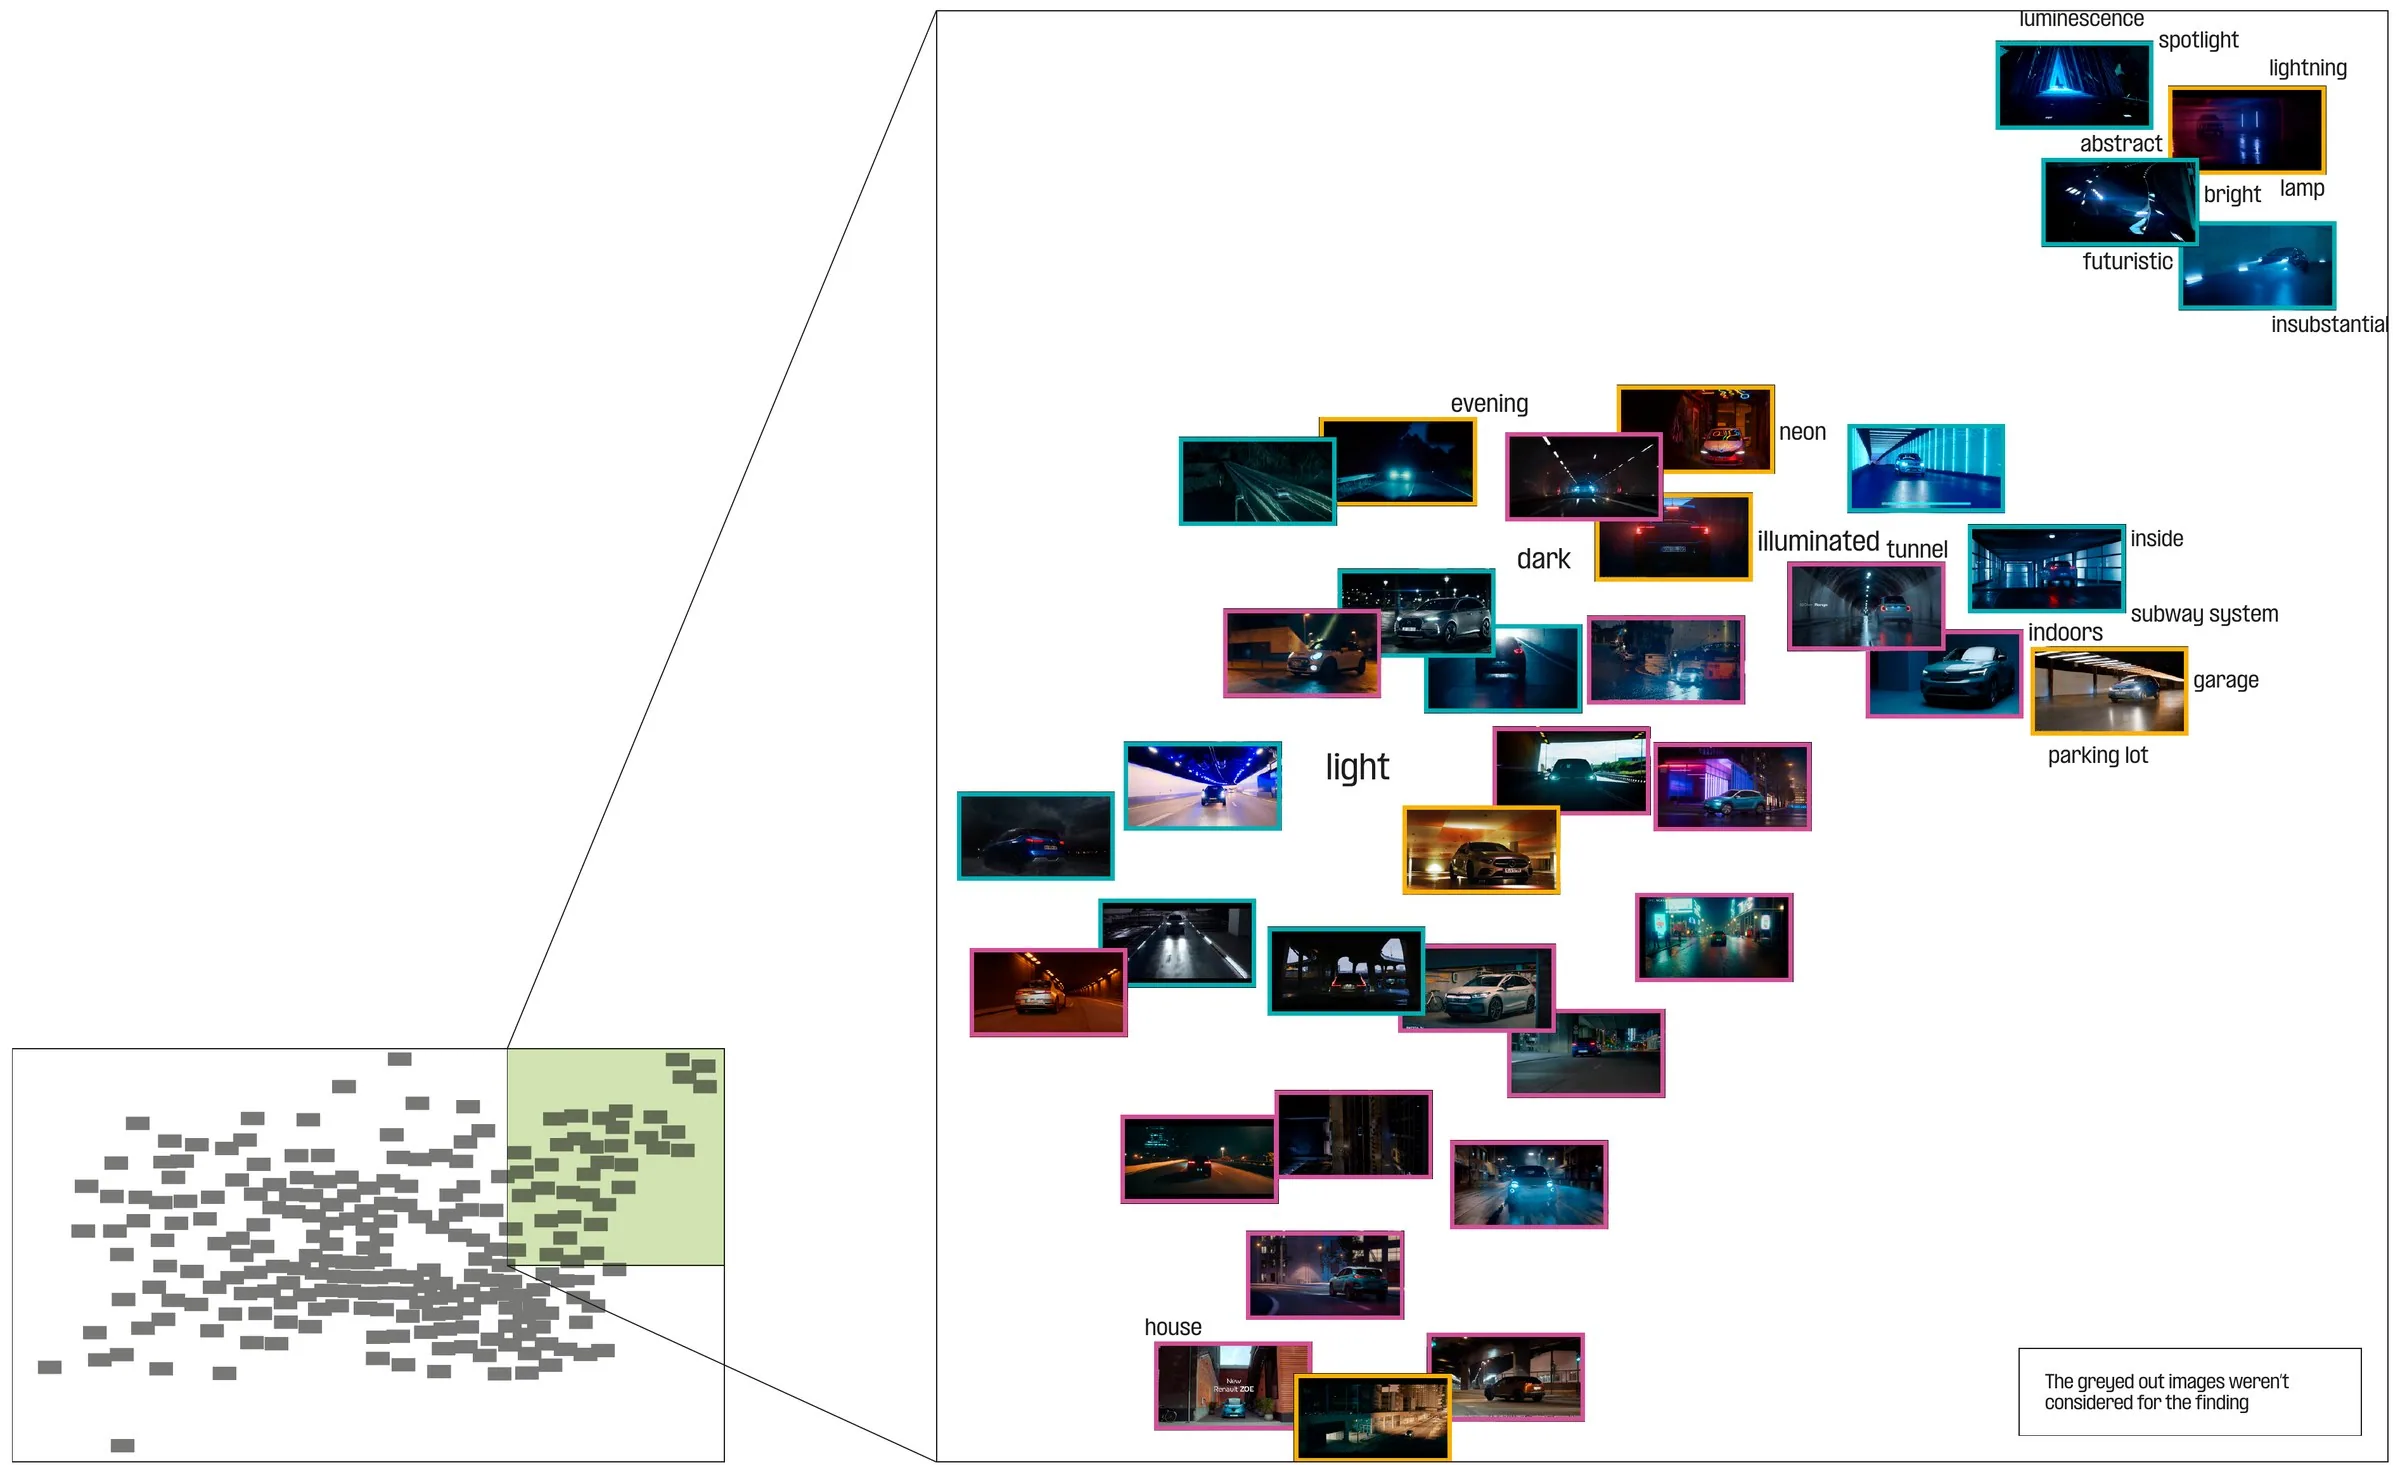
Every engine gets an empty landscape. Petrol cars get the wild, electric cars get the future.
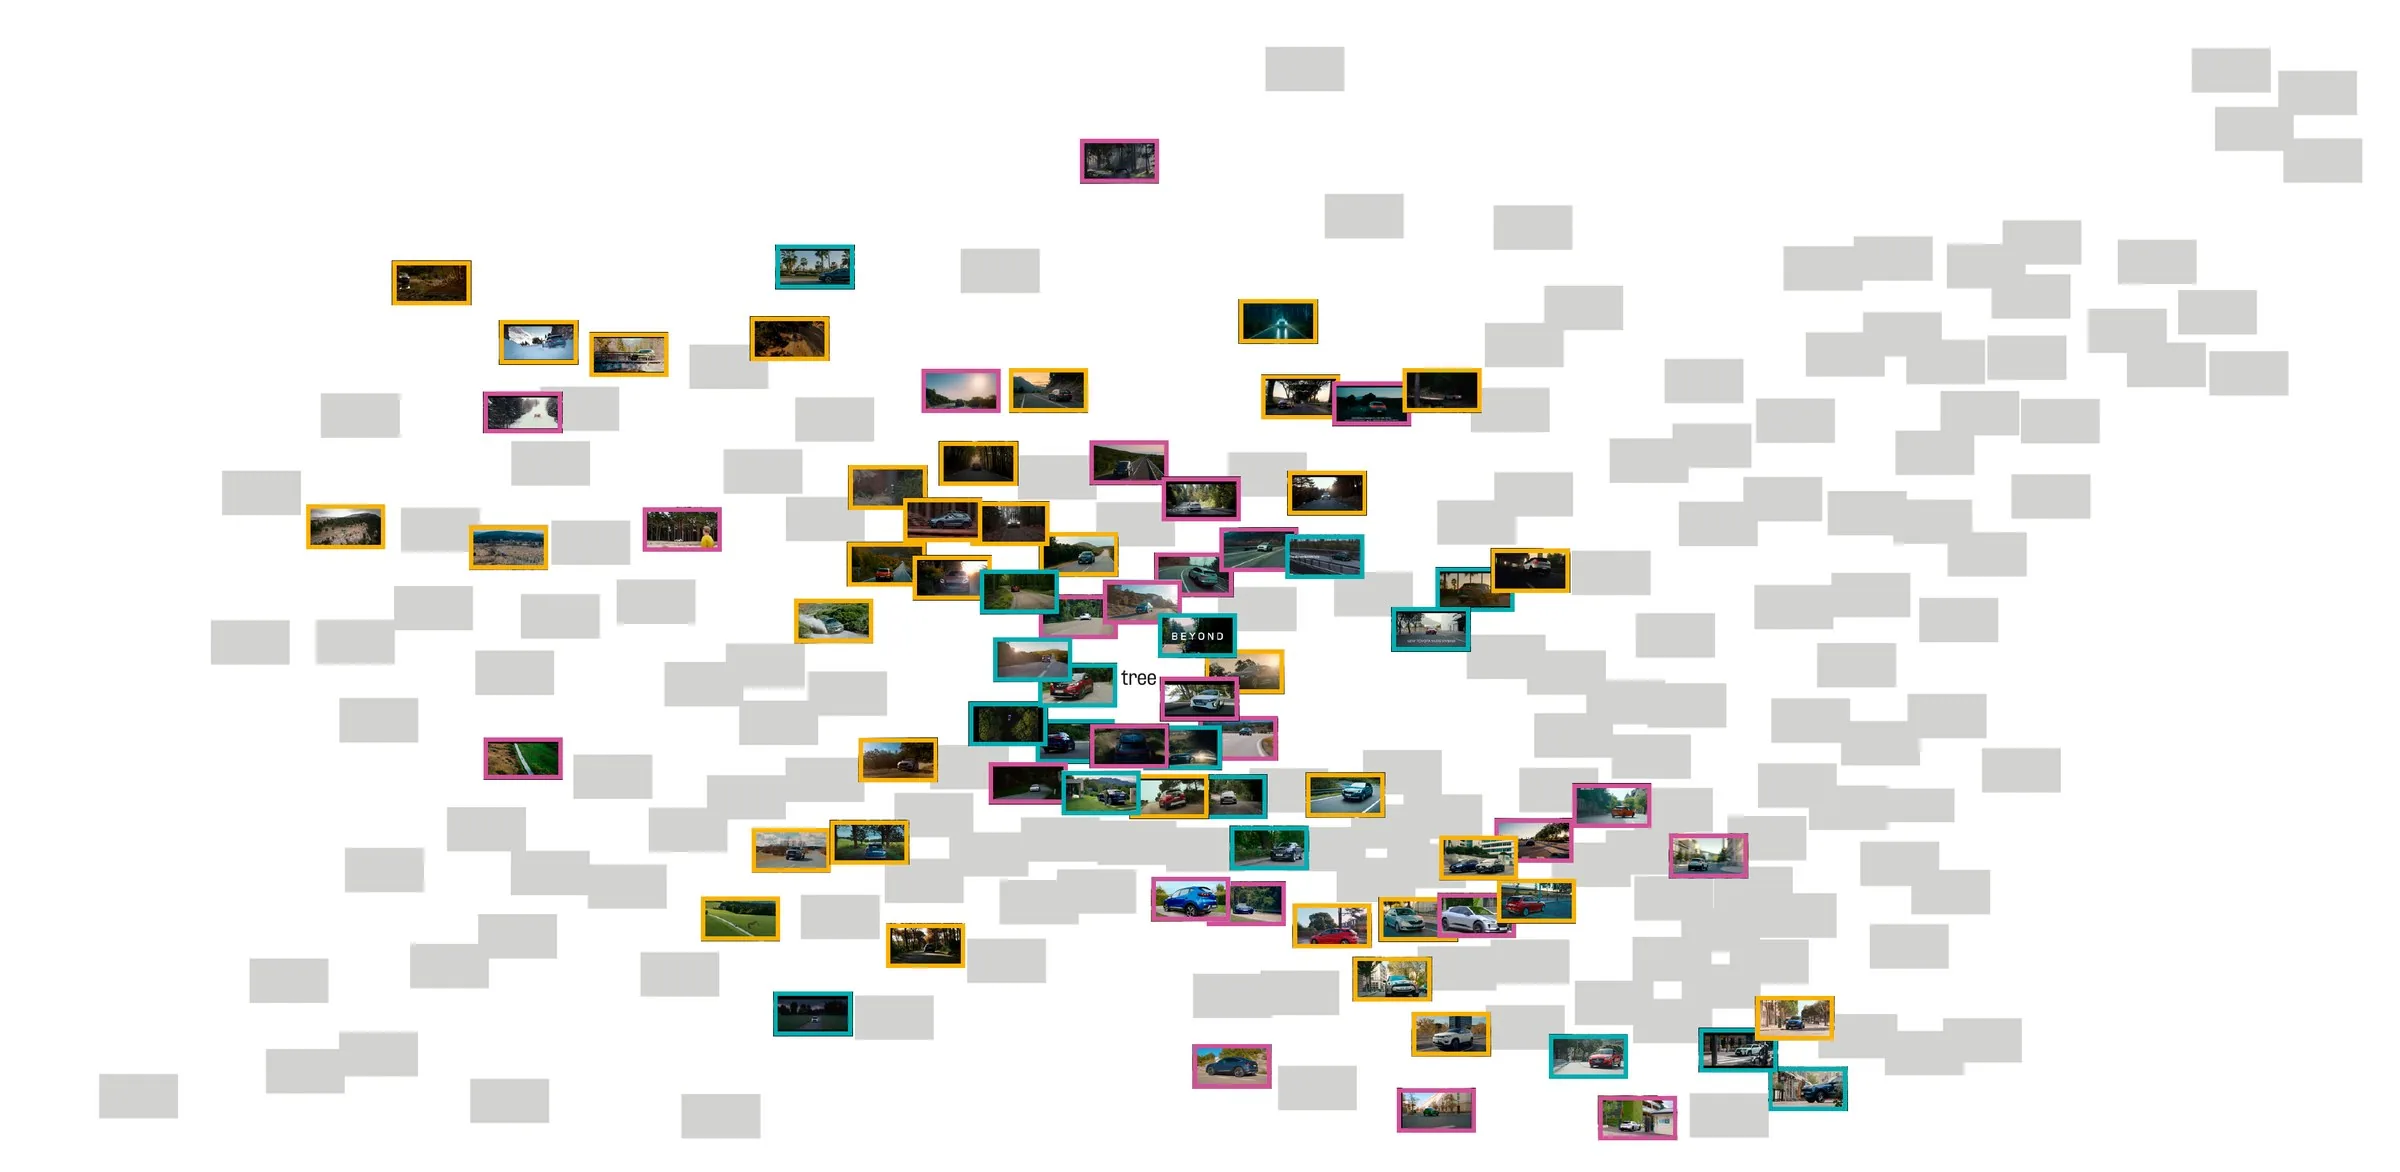
HowEvery advert frame, tagged by its setting and placed in a network by the tags it shares.
Key finding · Finding 04
Trees appear in more than one third of the scenes
Right after road, asphalt, outdoors and daylight, tree is one of the most common elements, with 78 occurrences, even in urban settings.
Question 02 · Narrative strategies · 4 findings
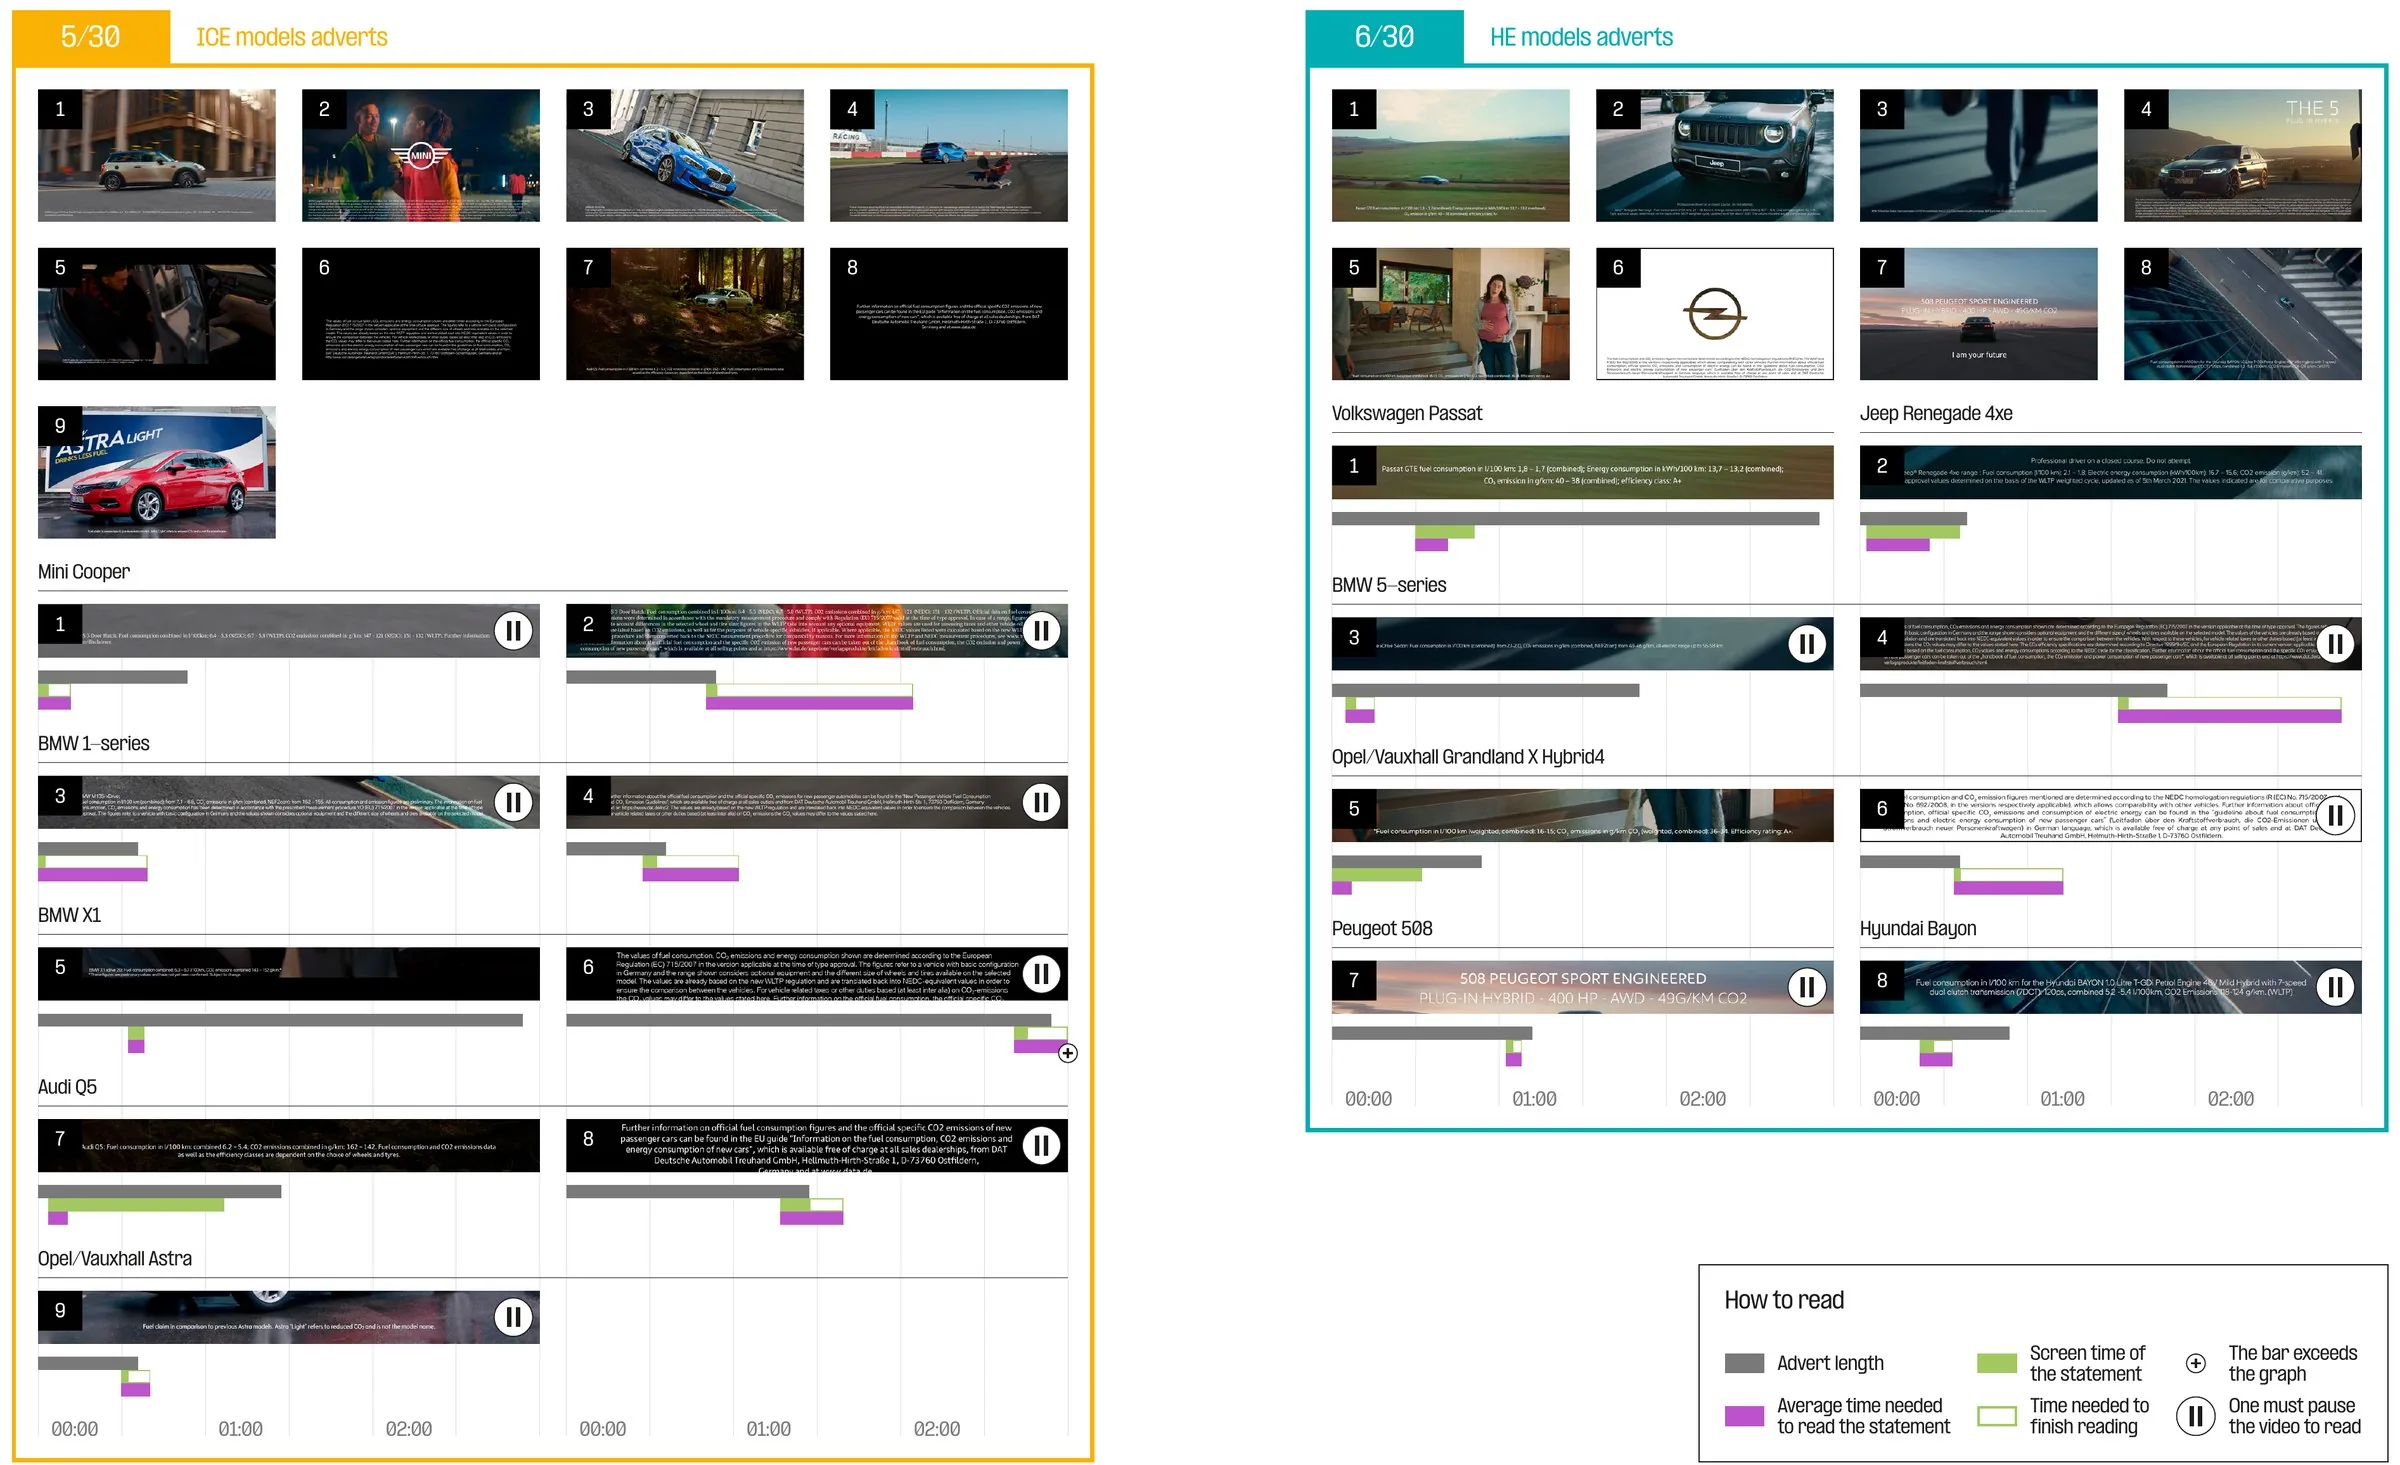
The fine print is there. It just leaves before you can read it.
HowEvery advert storyboarded; similar sequences clustered, named and ranked by how often they appear.
Measured with OCR, Read-o-Meter and The Read Time.
Key finding · Strategy 4 · Finding 04
If included, most adverts don’t give enough time to read emissions and consumption information
It sits at the very end, in a small block of text, often shown for less time than reading needs.
Question 03 · Descriptions · 5 findings
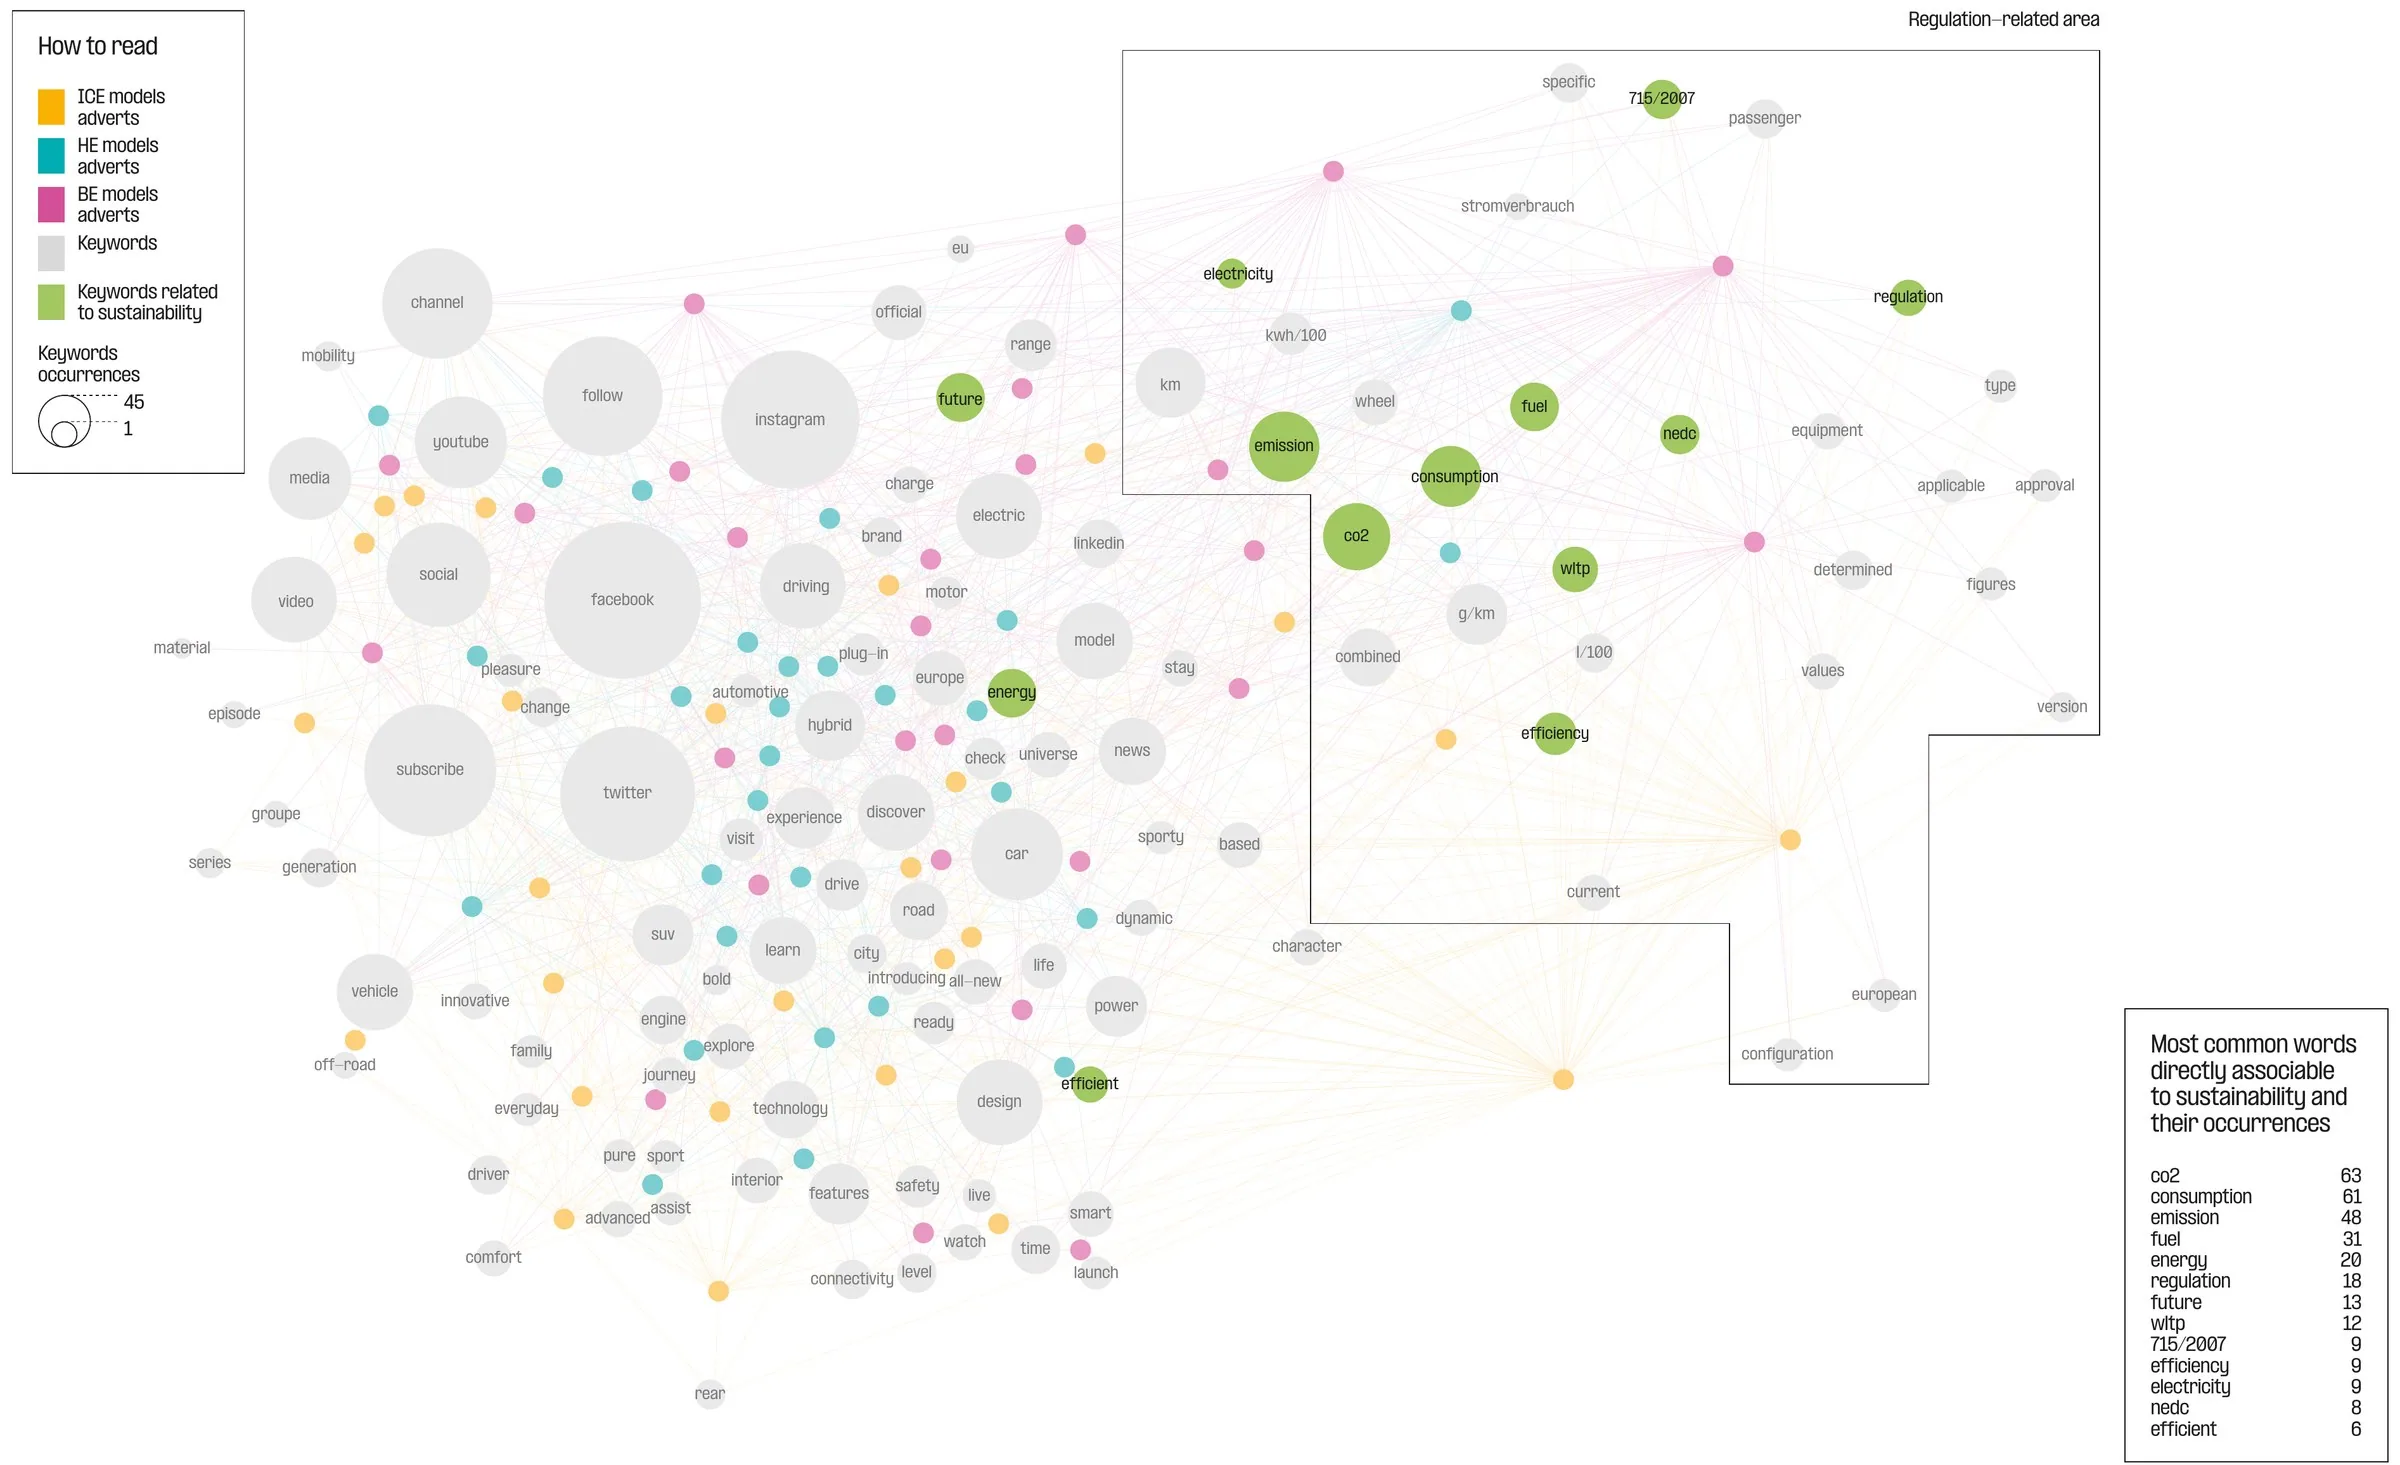
In writing, brands talk compliance, not ecology.
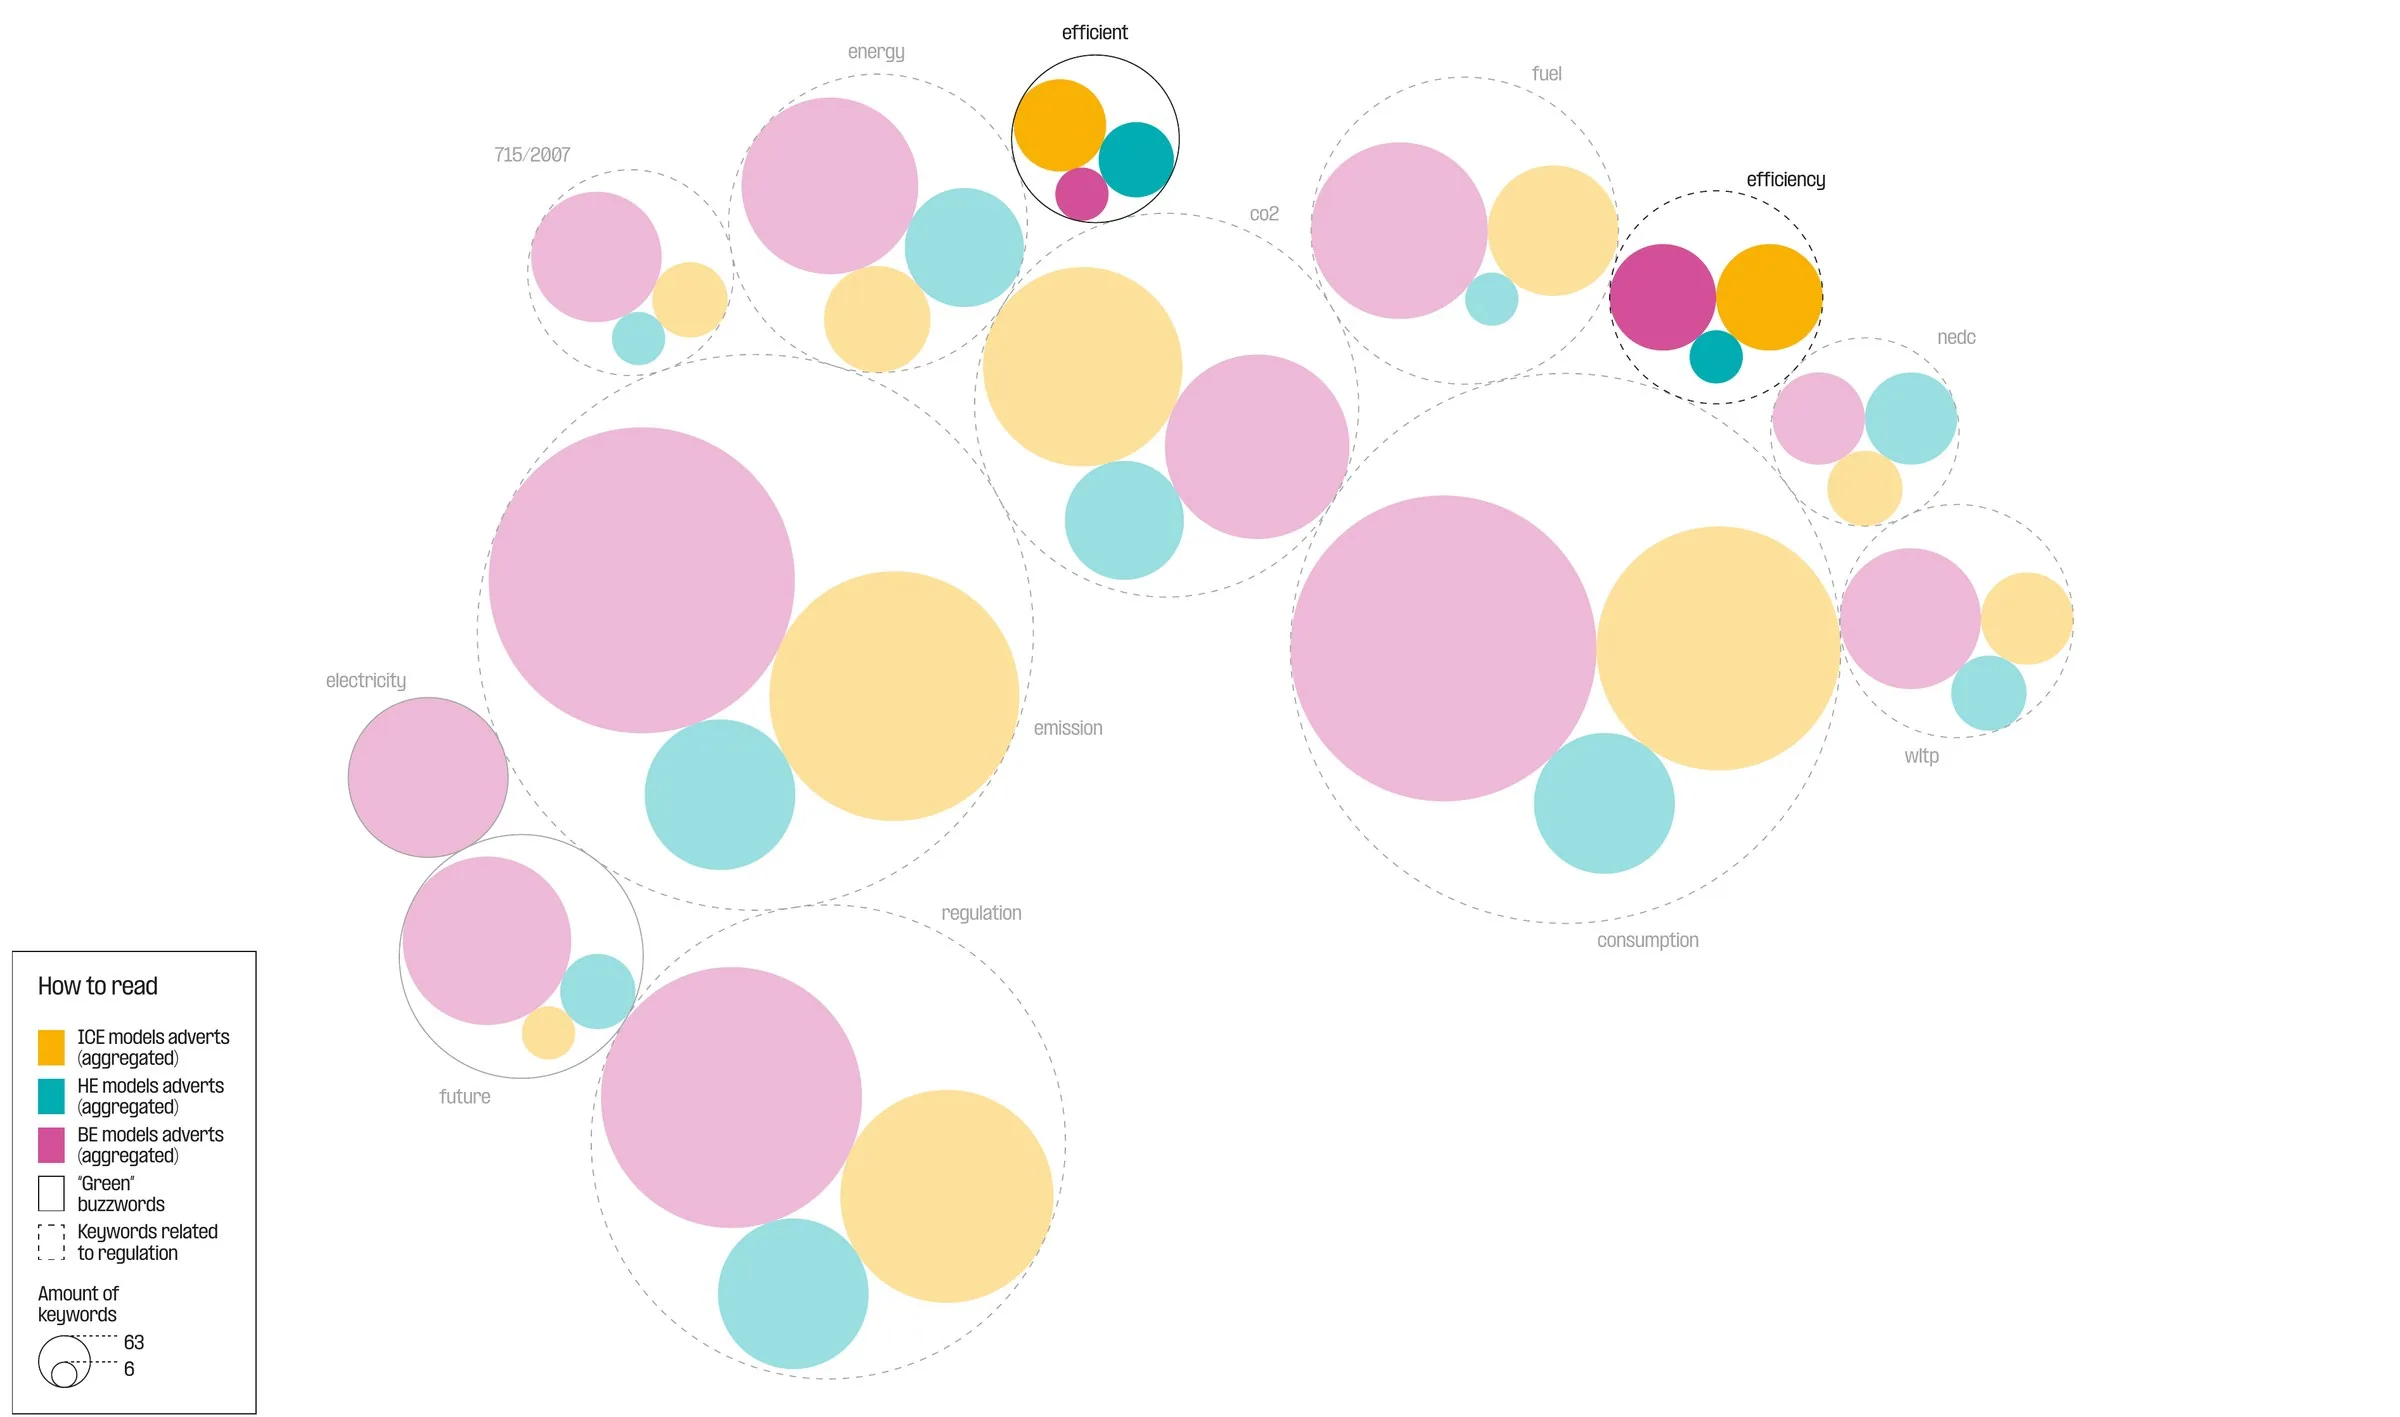
HowSustainability keywords in the 90 YouTube descriptions, counted by engine and by brand.
Key finding · Finding 01
Typical “green” buzzwords are uncommon and context-dependent
A separate area of regulation keywords suggests brands prefer to stress compliance with standards rather than make bold claims.
The other ten findings
The three key findings are above. Select any of the other ten to see its chart.
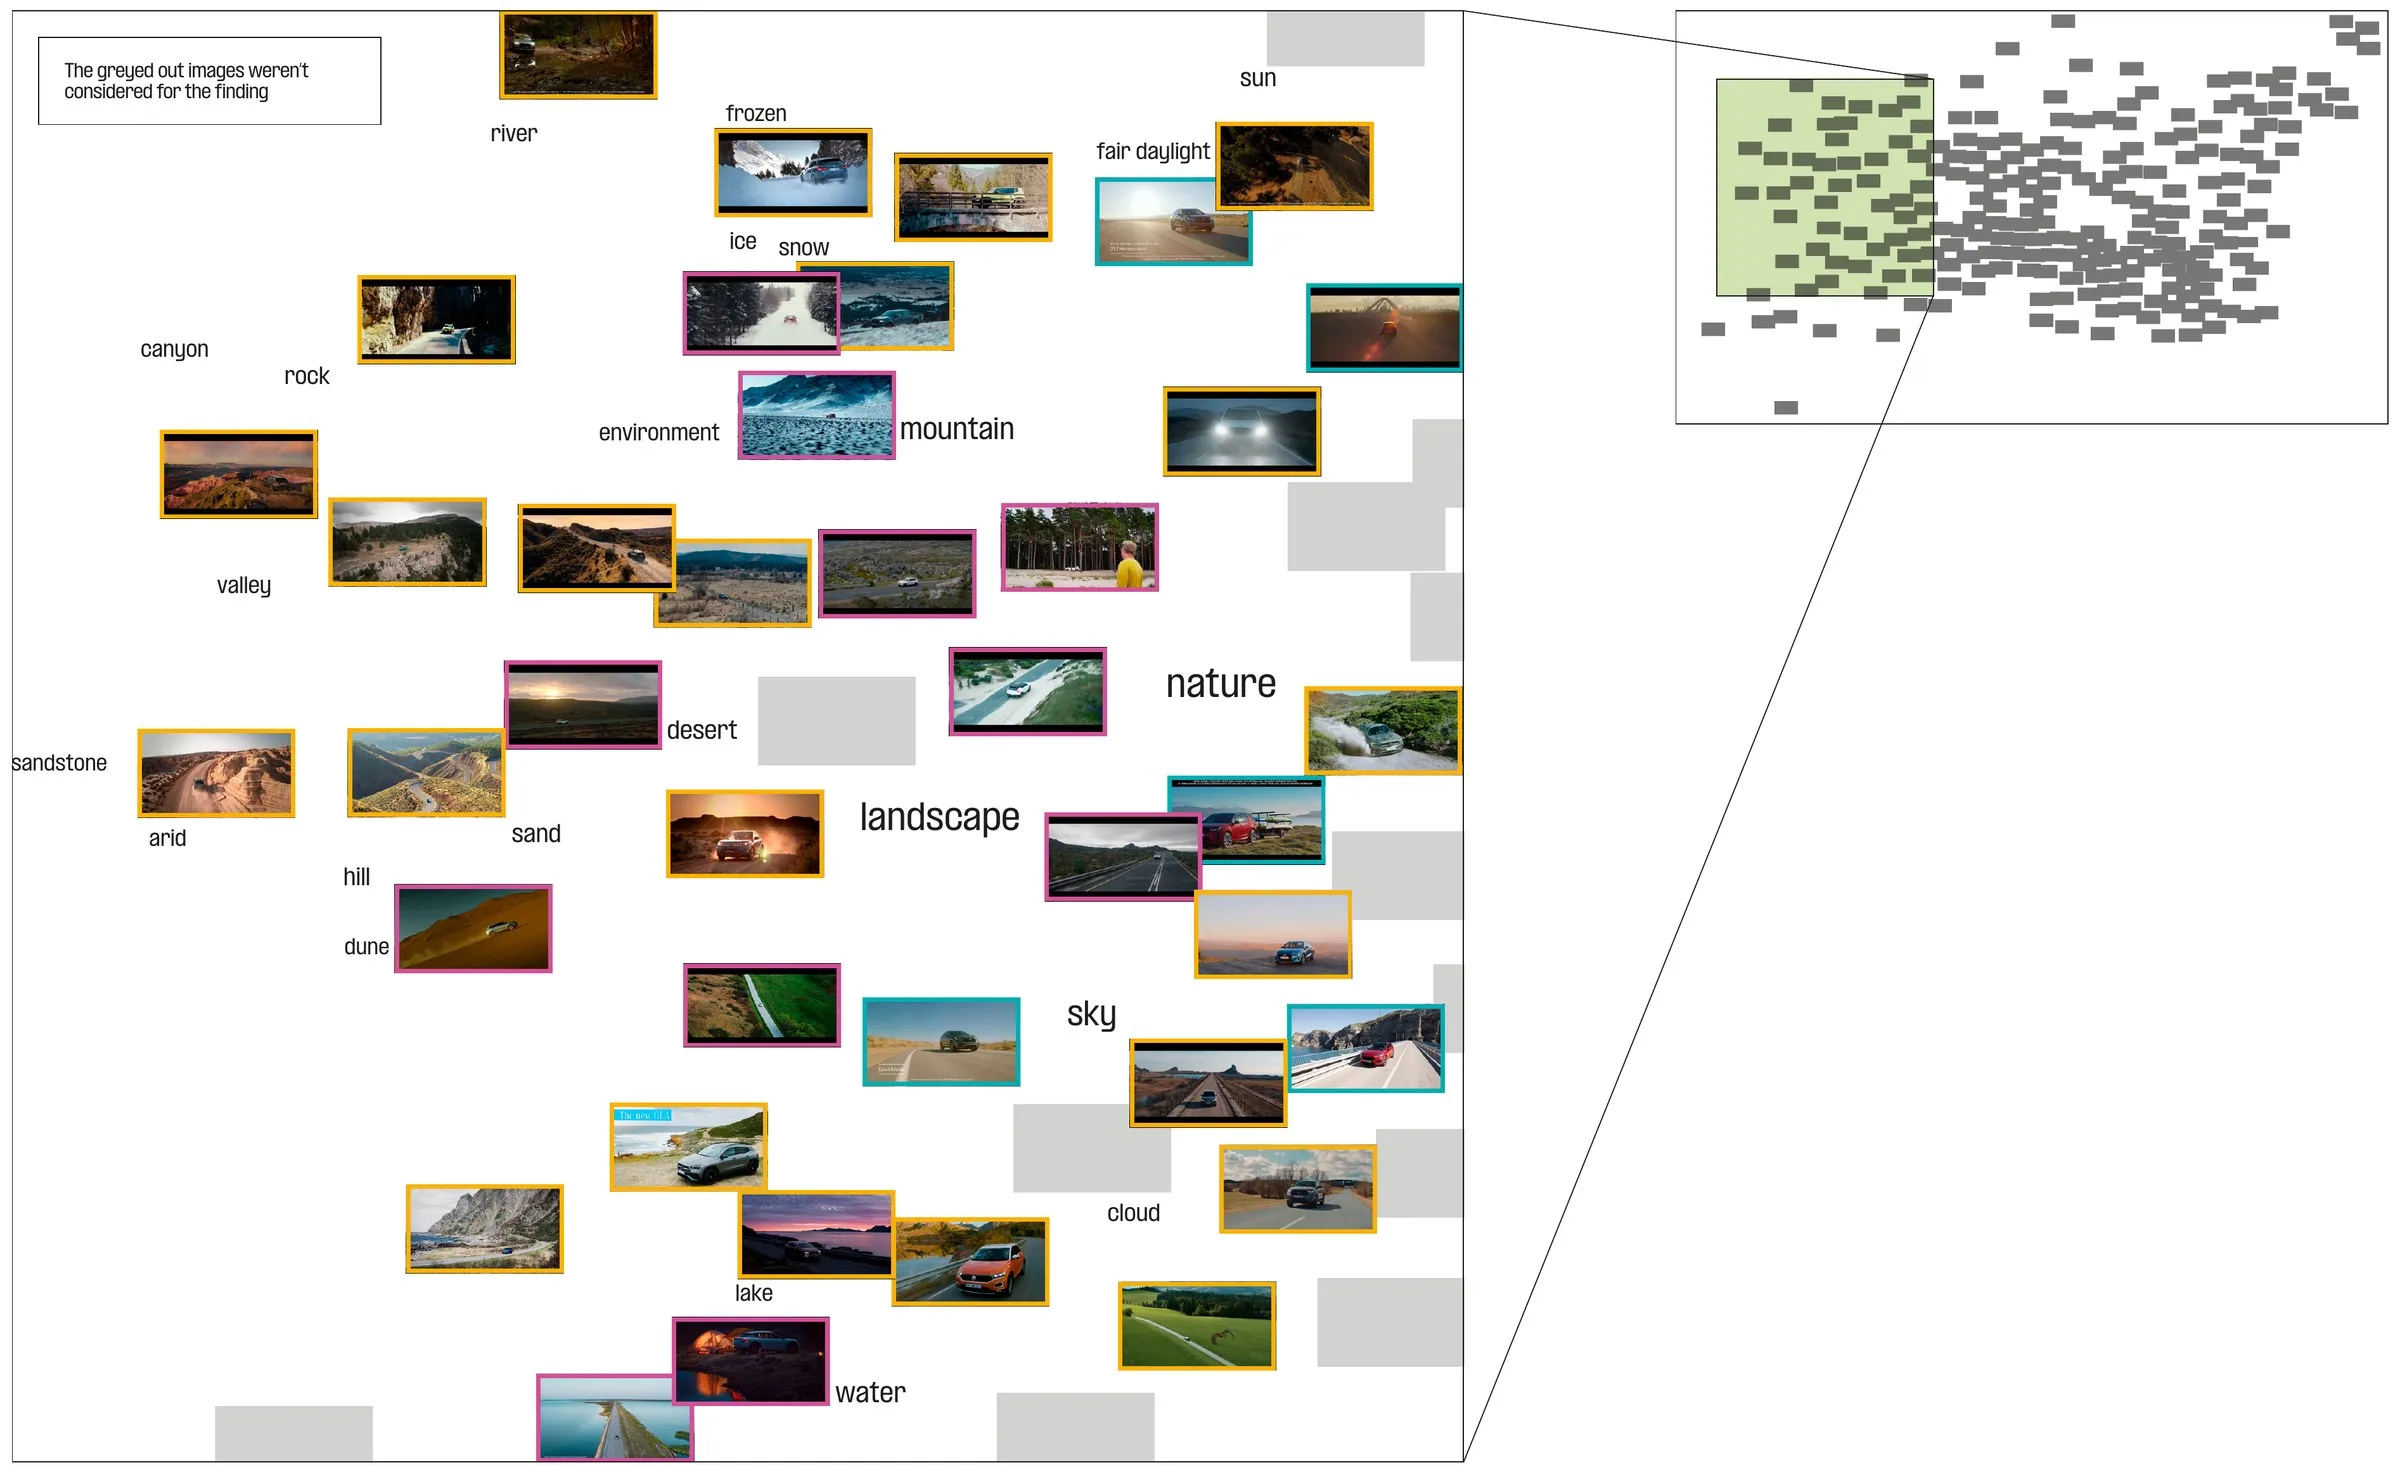
How to read · The green area on the small map shows the enlarged part. Greyed-out frames were not considered.
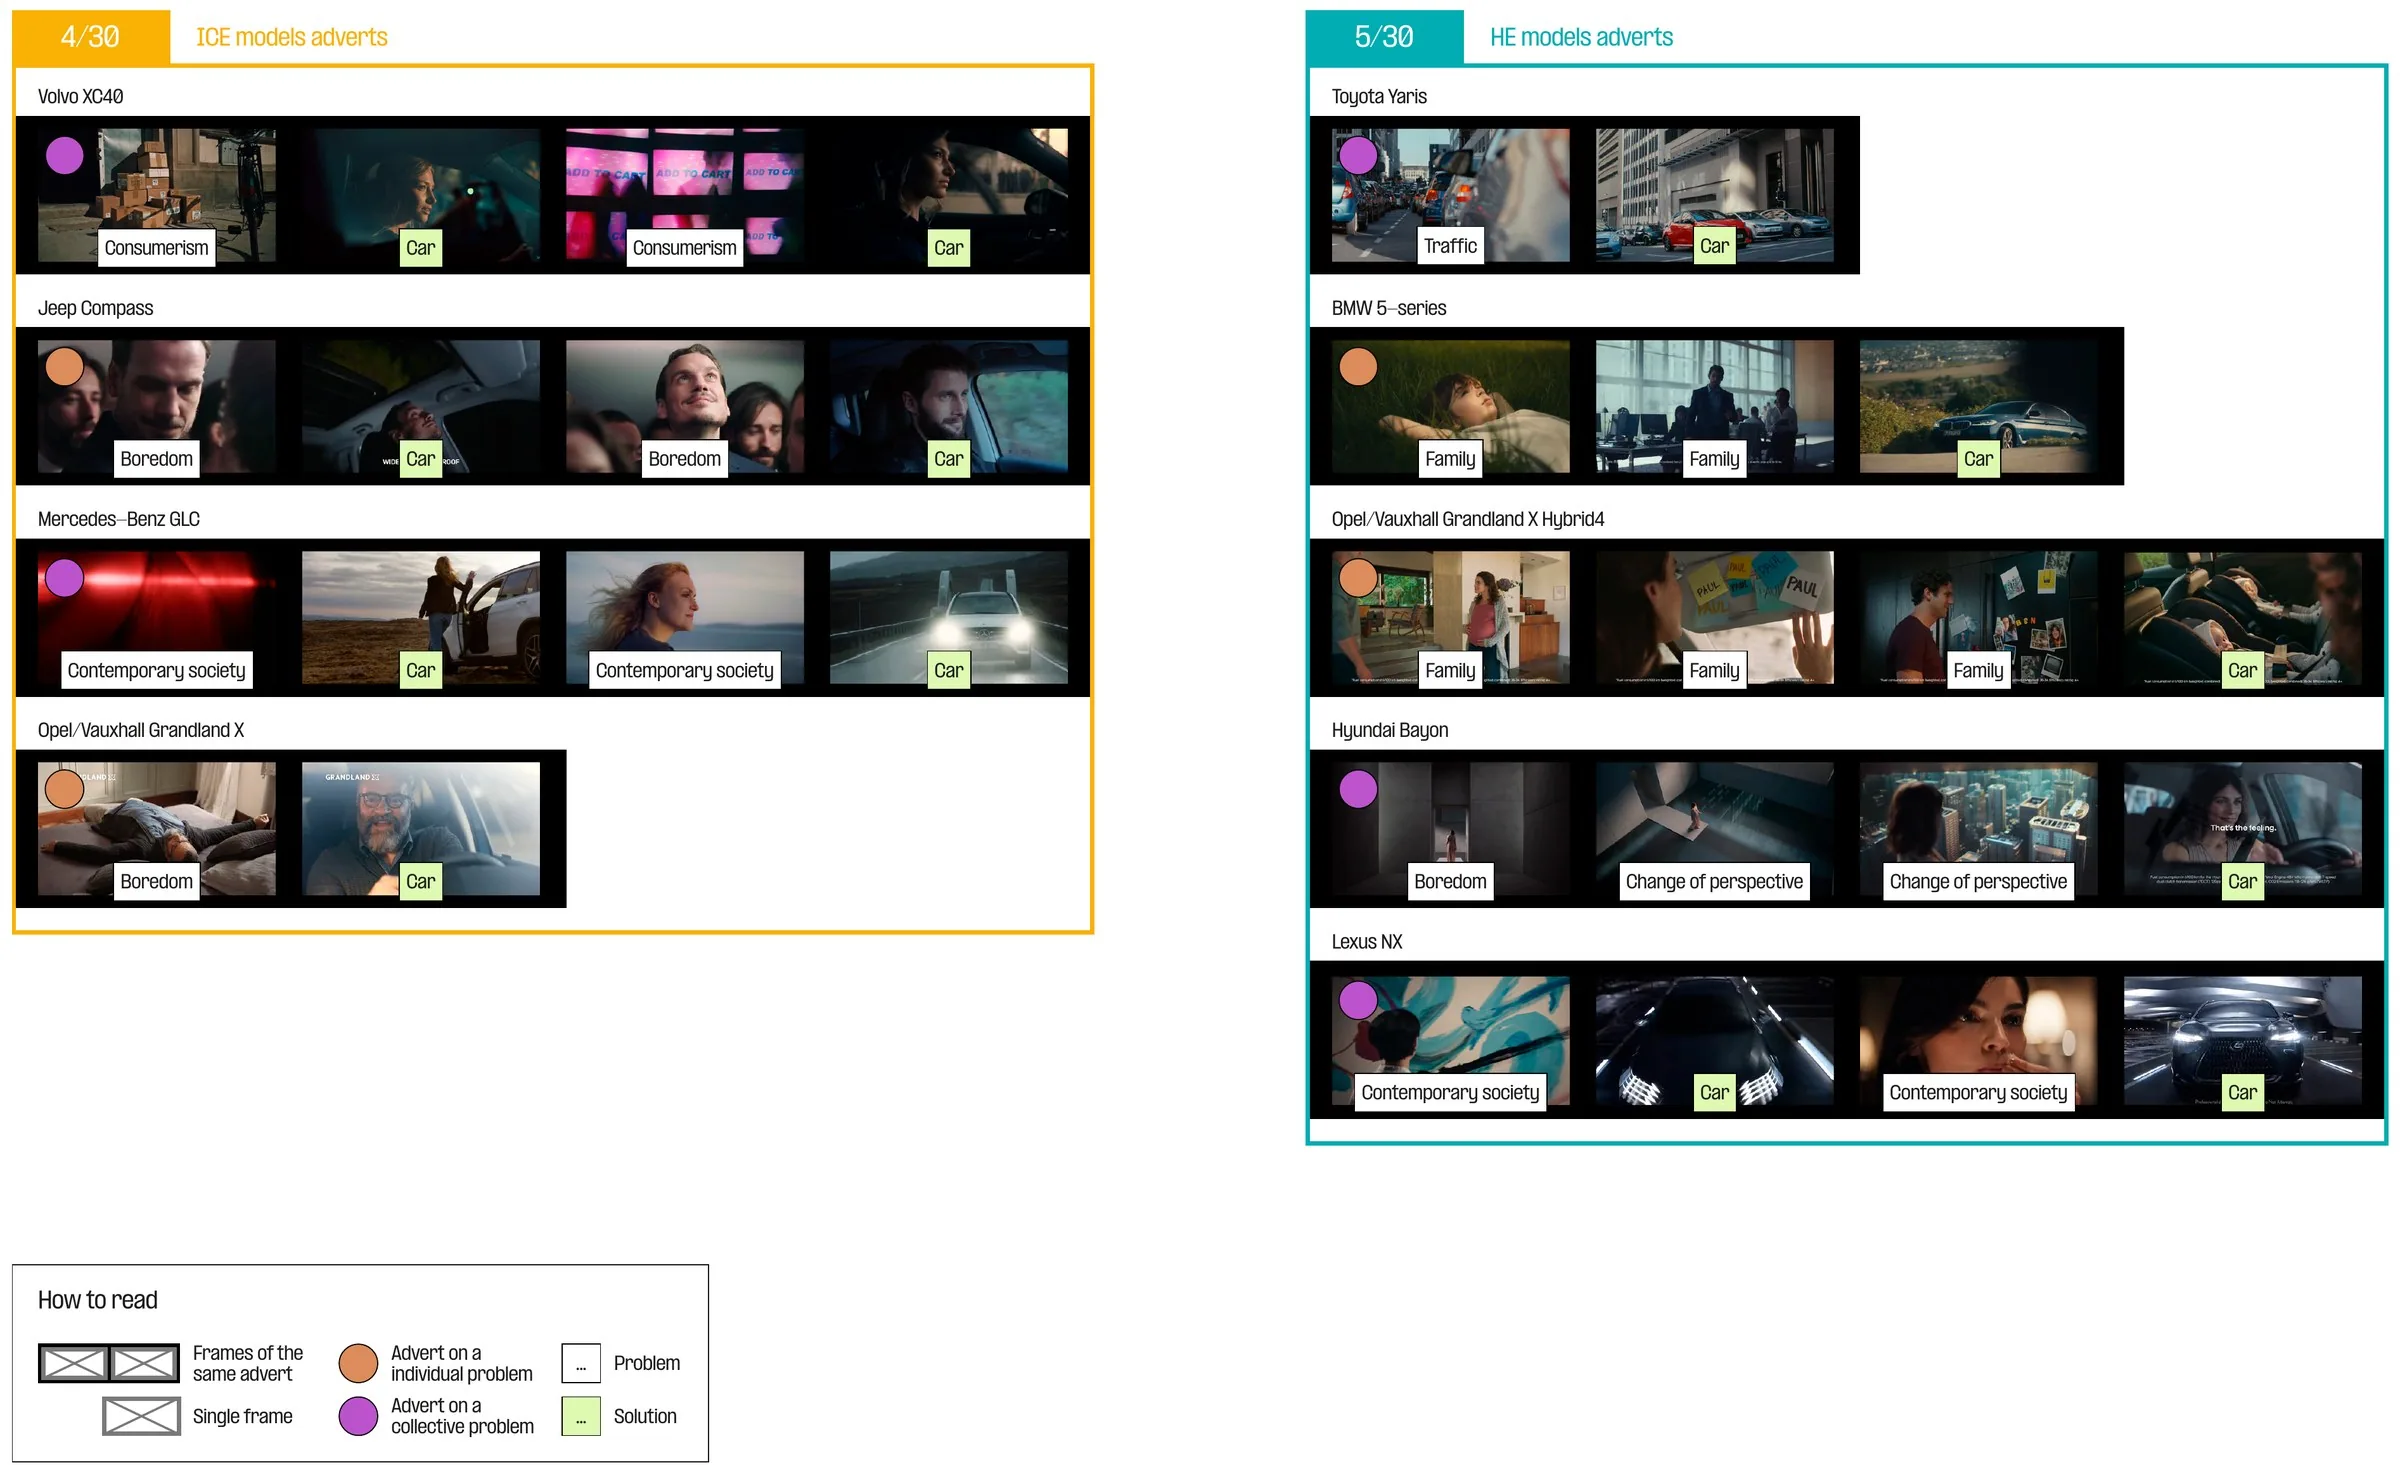
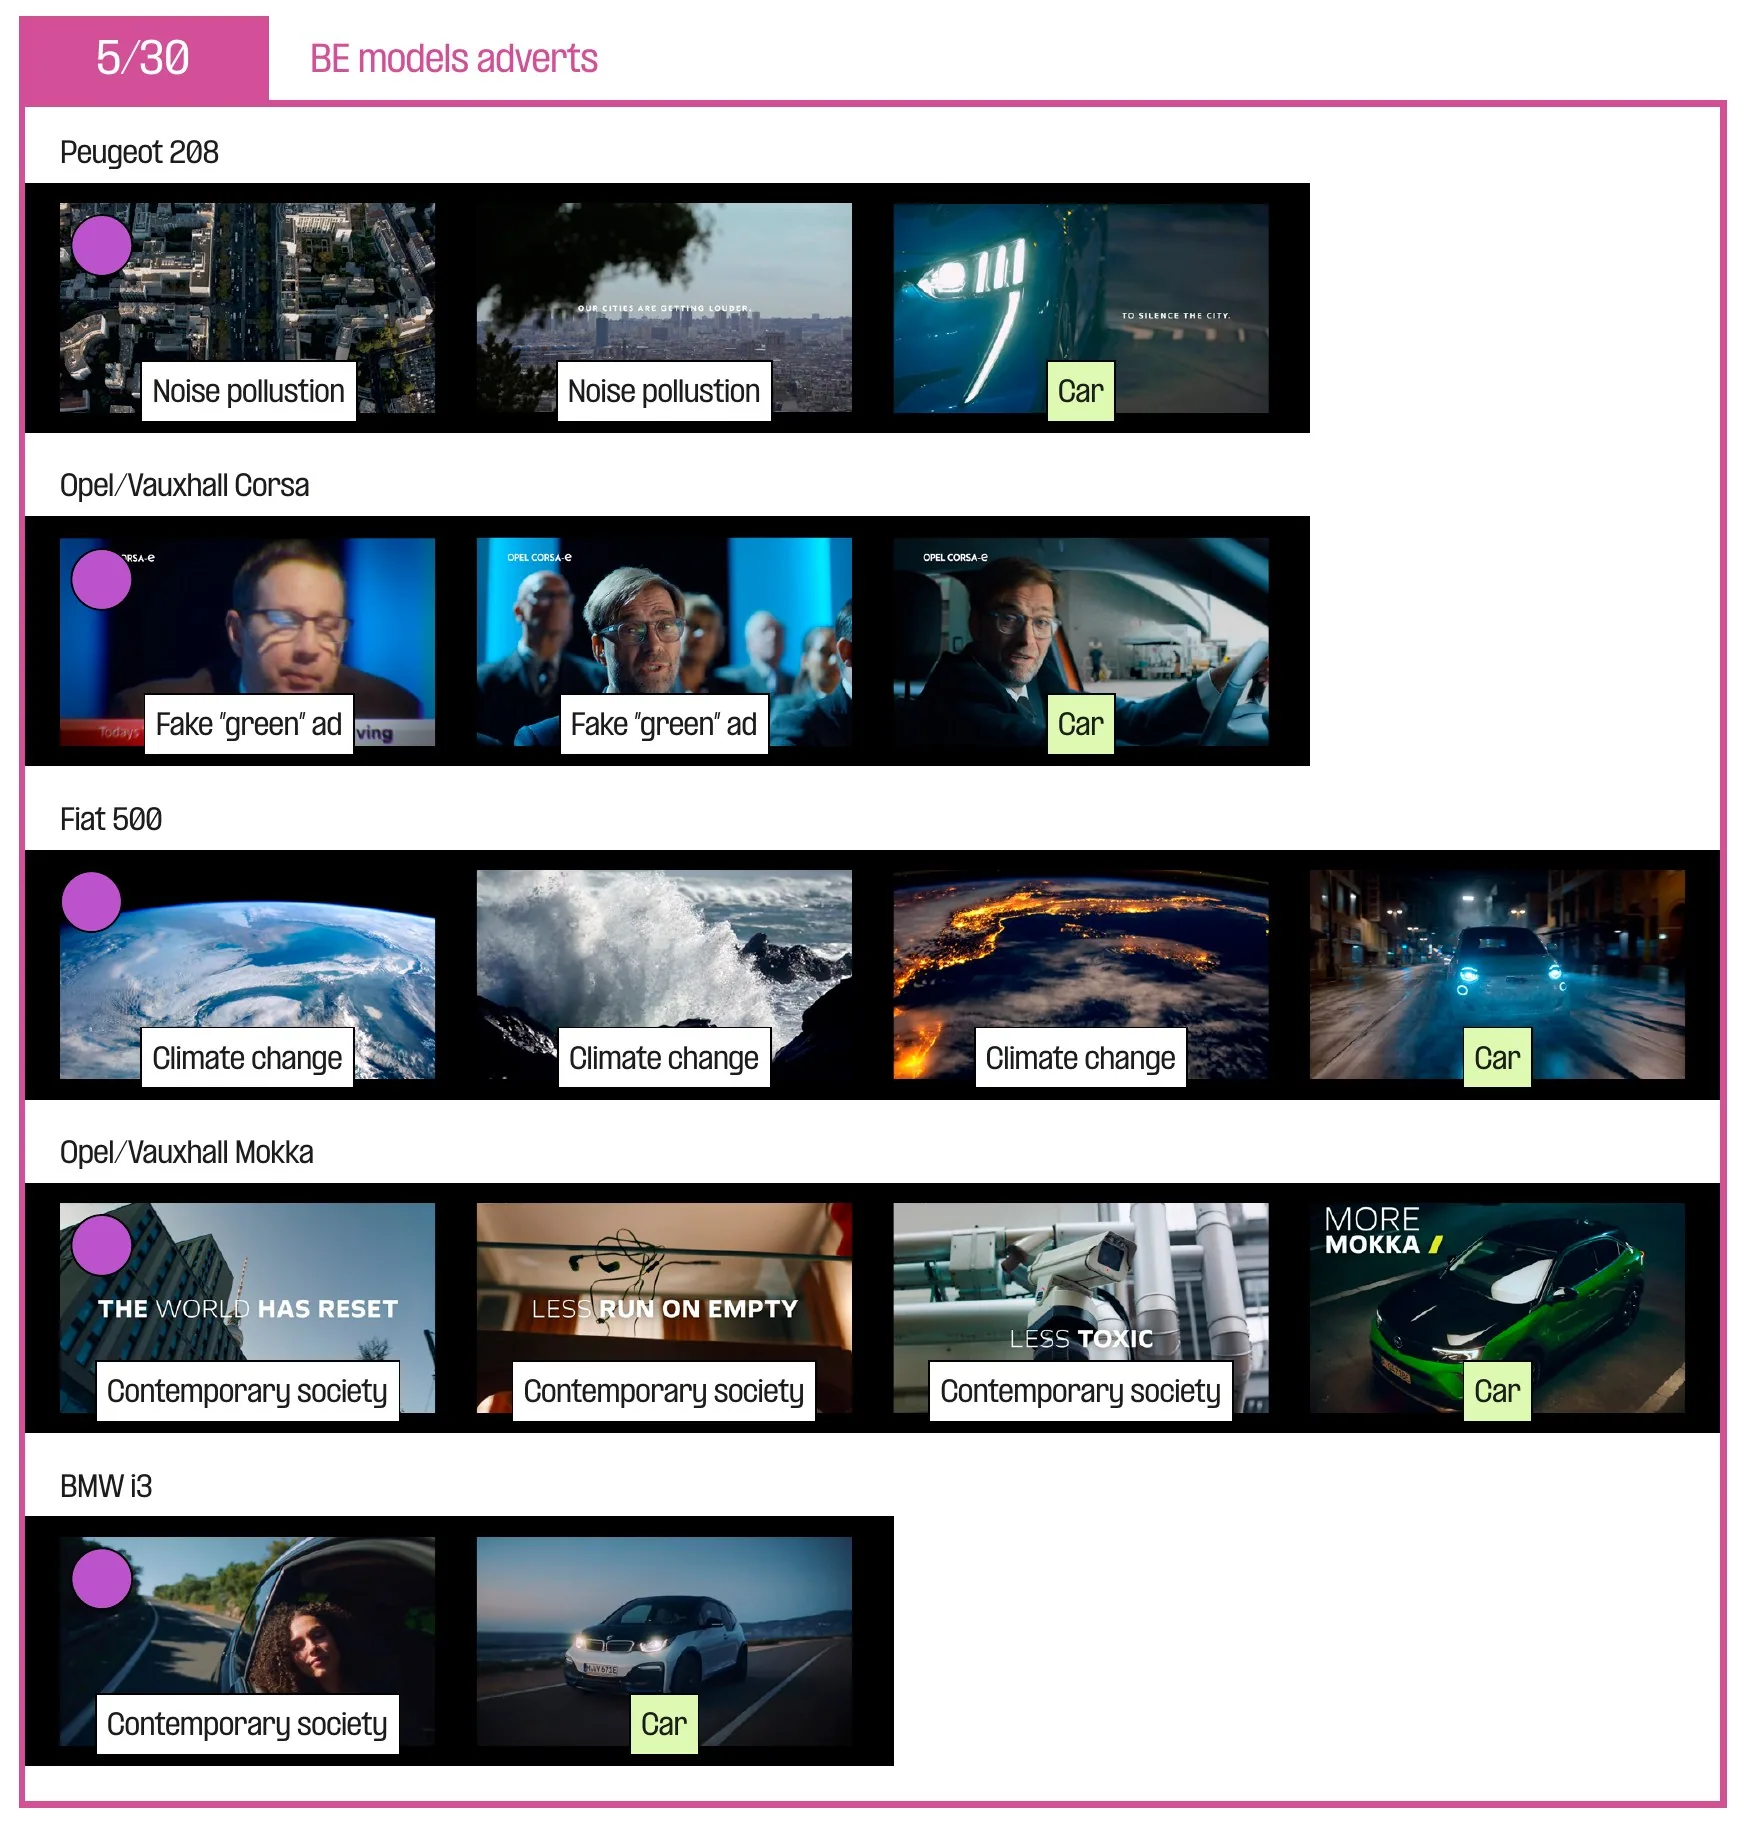
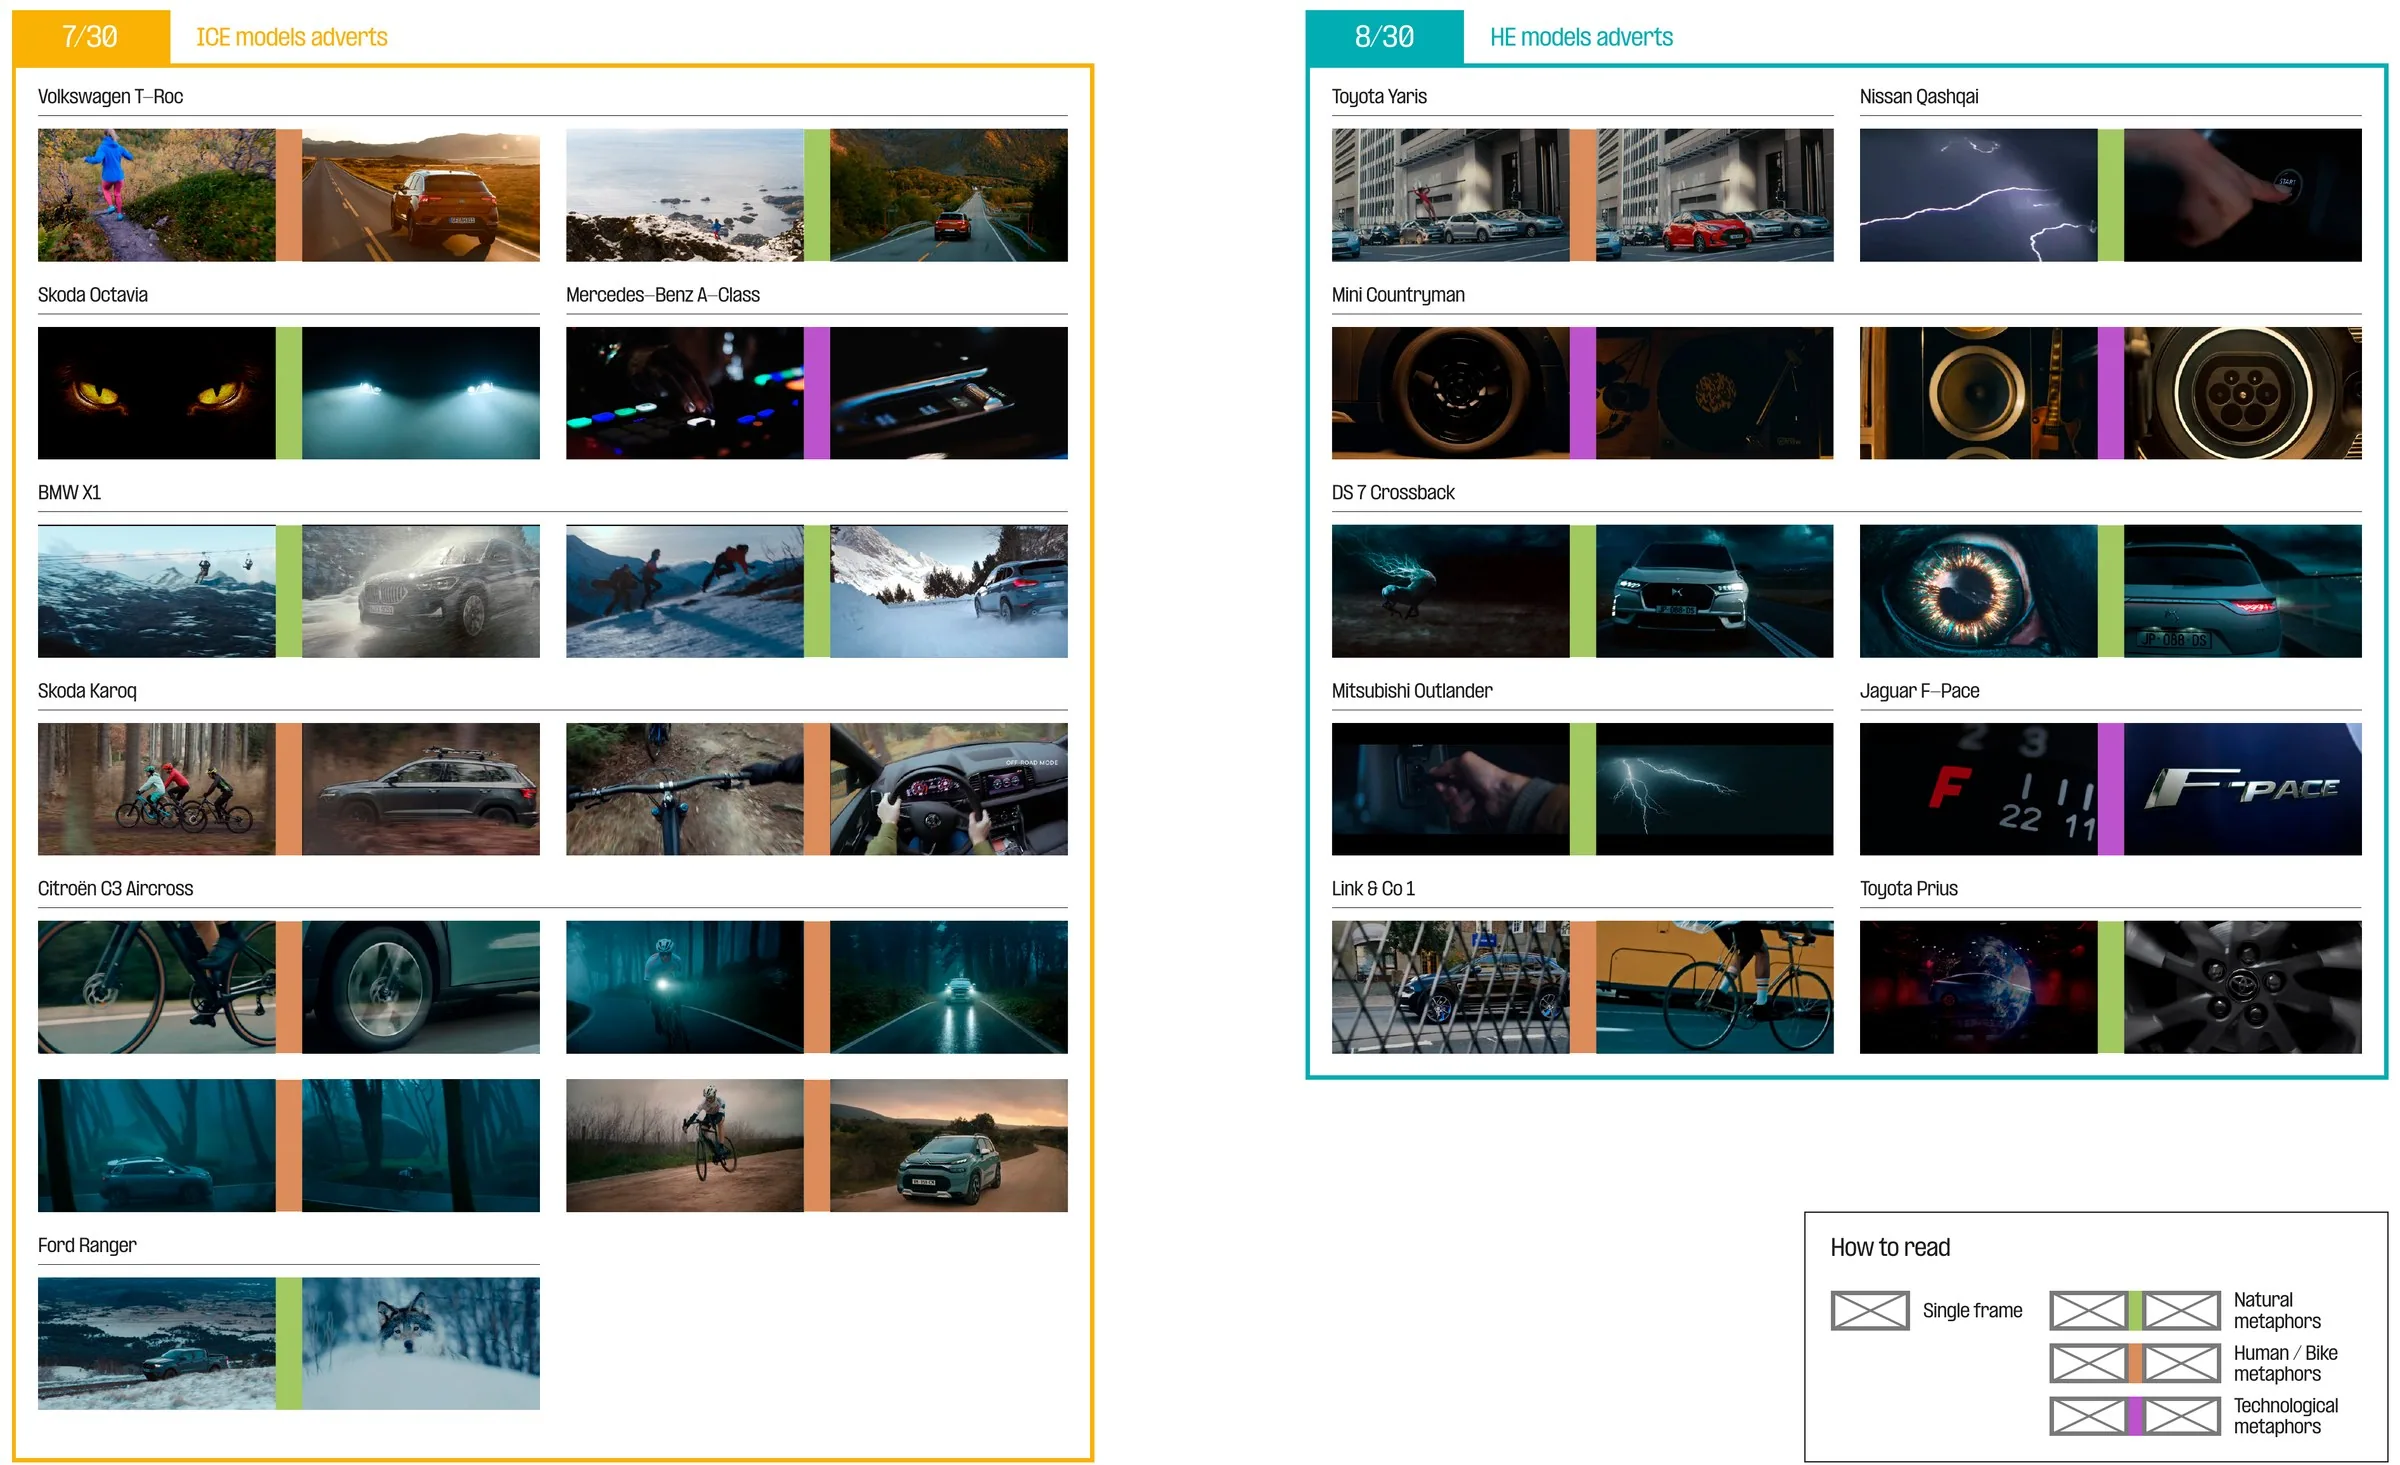
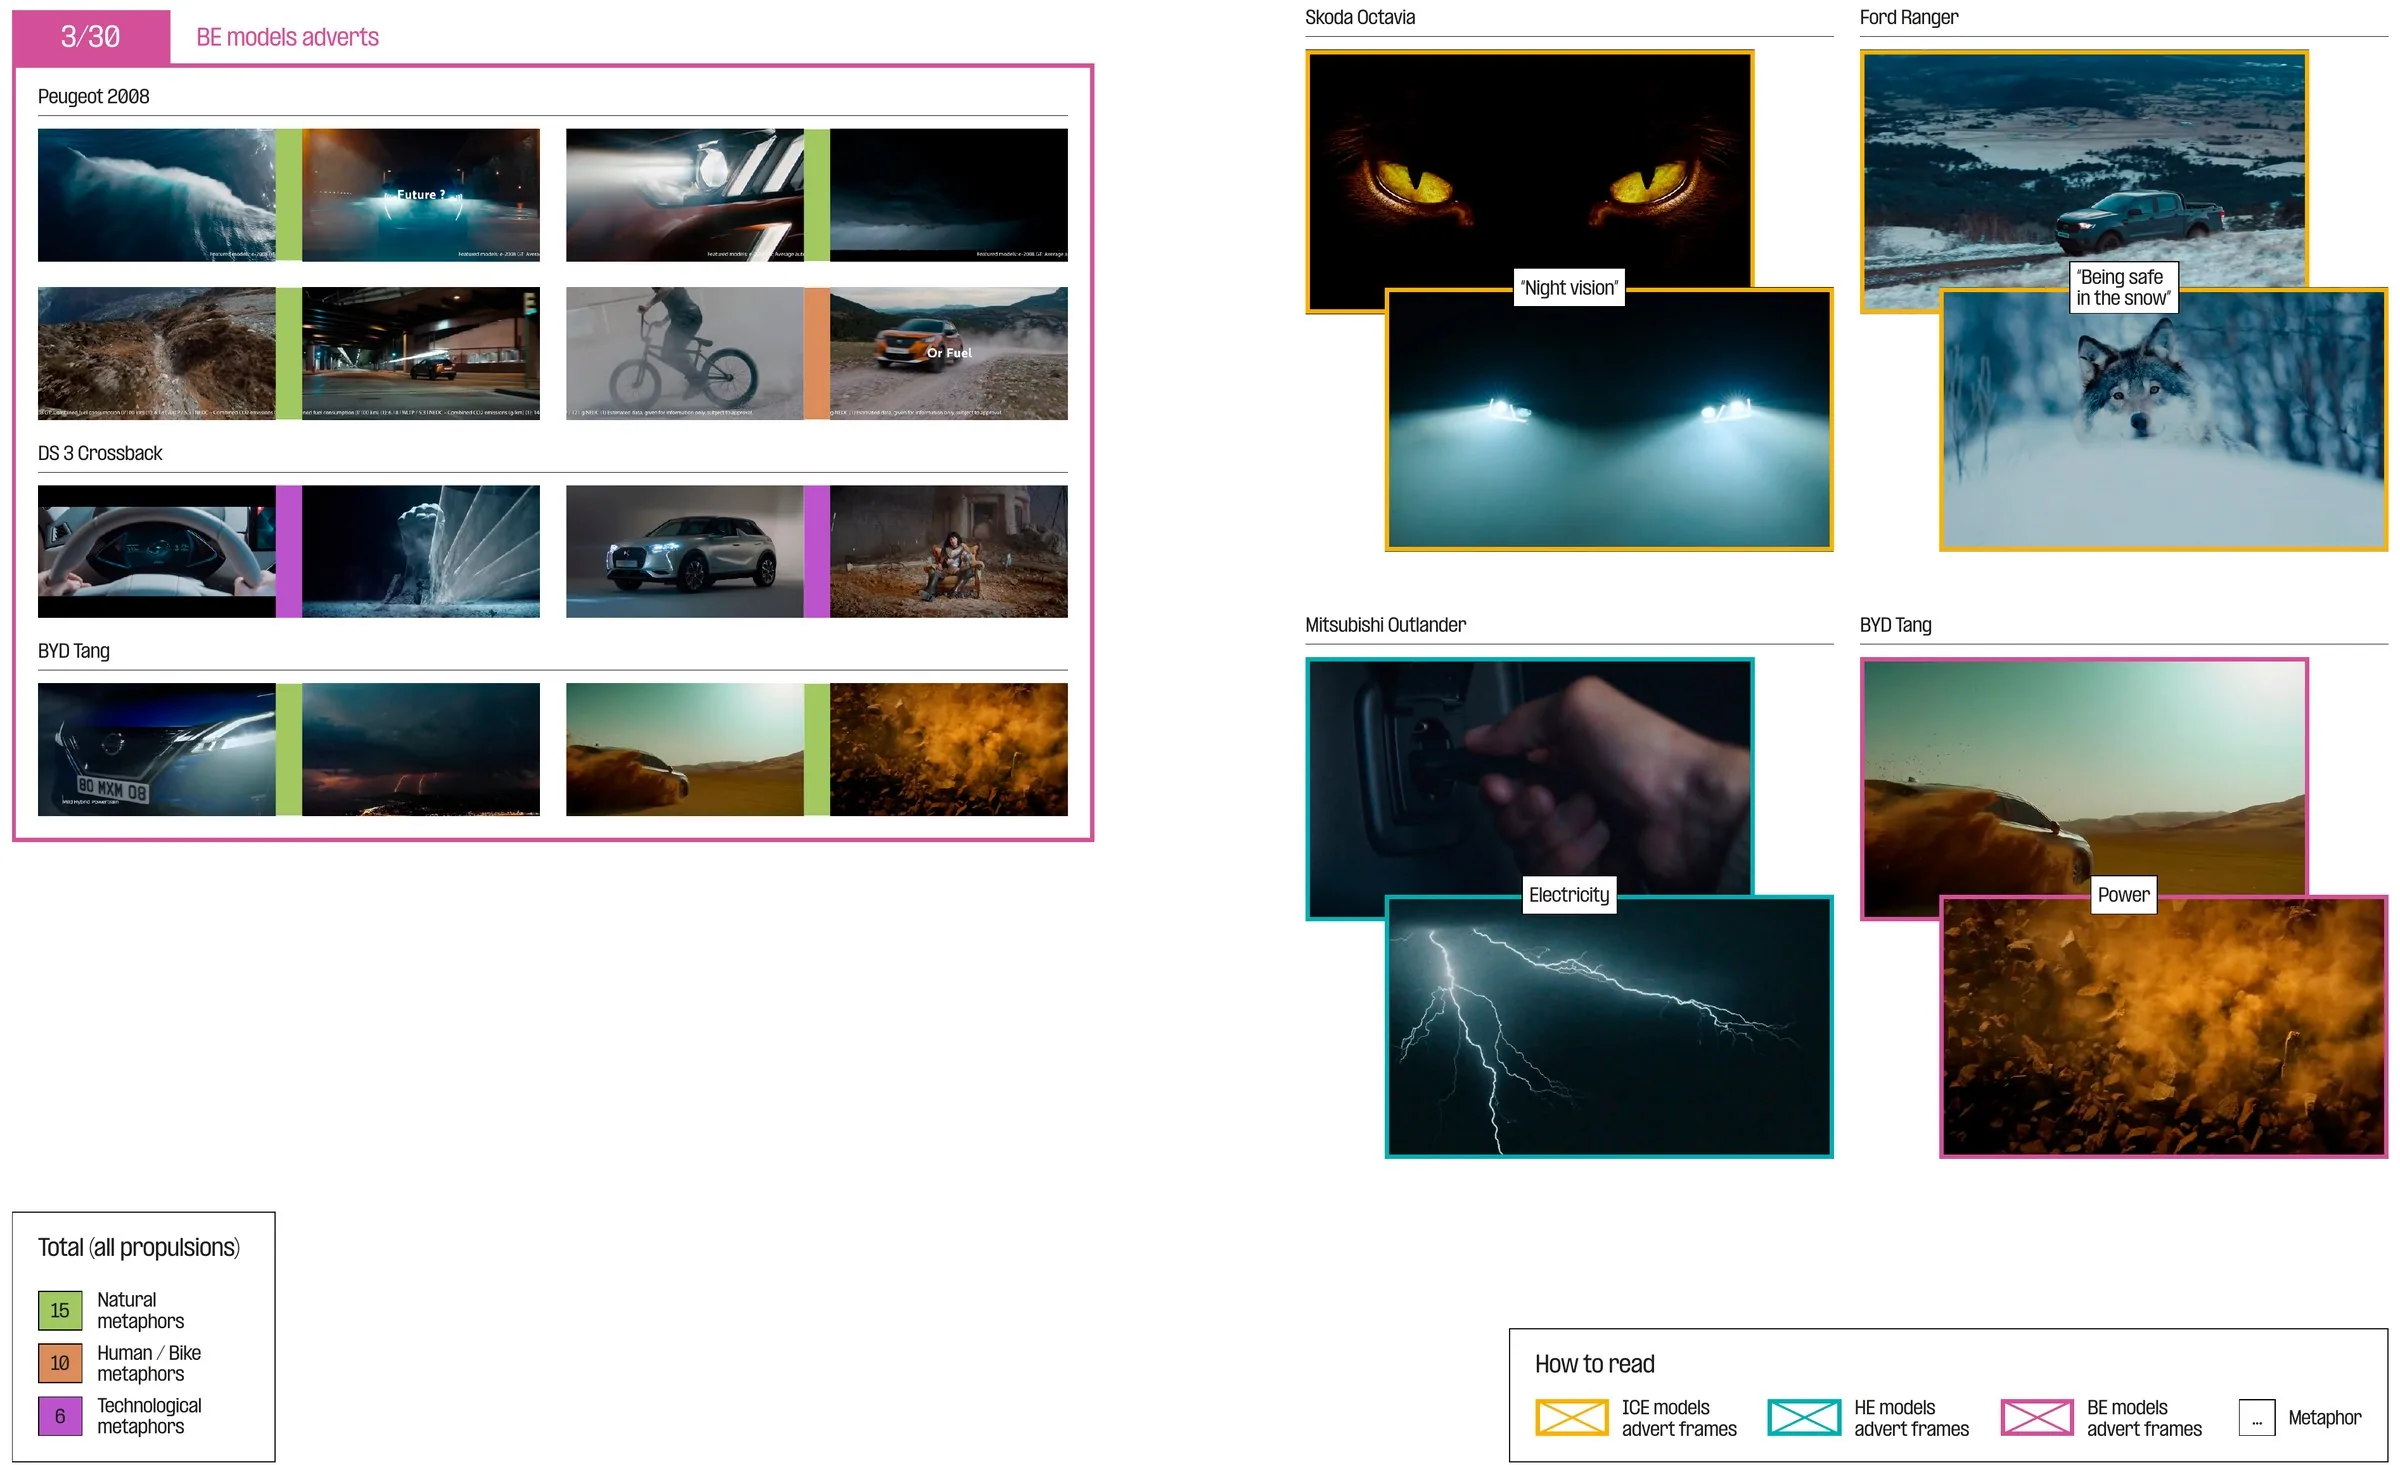
How to read · Each strip is one advert. White labels mark the problem, green labels the car; the dot shows an individual (orange) or collective (purple) problem.
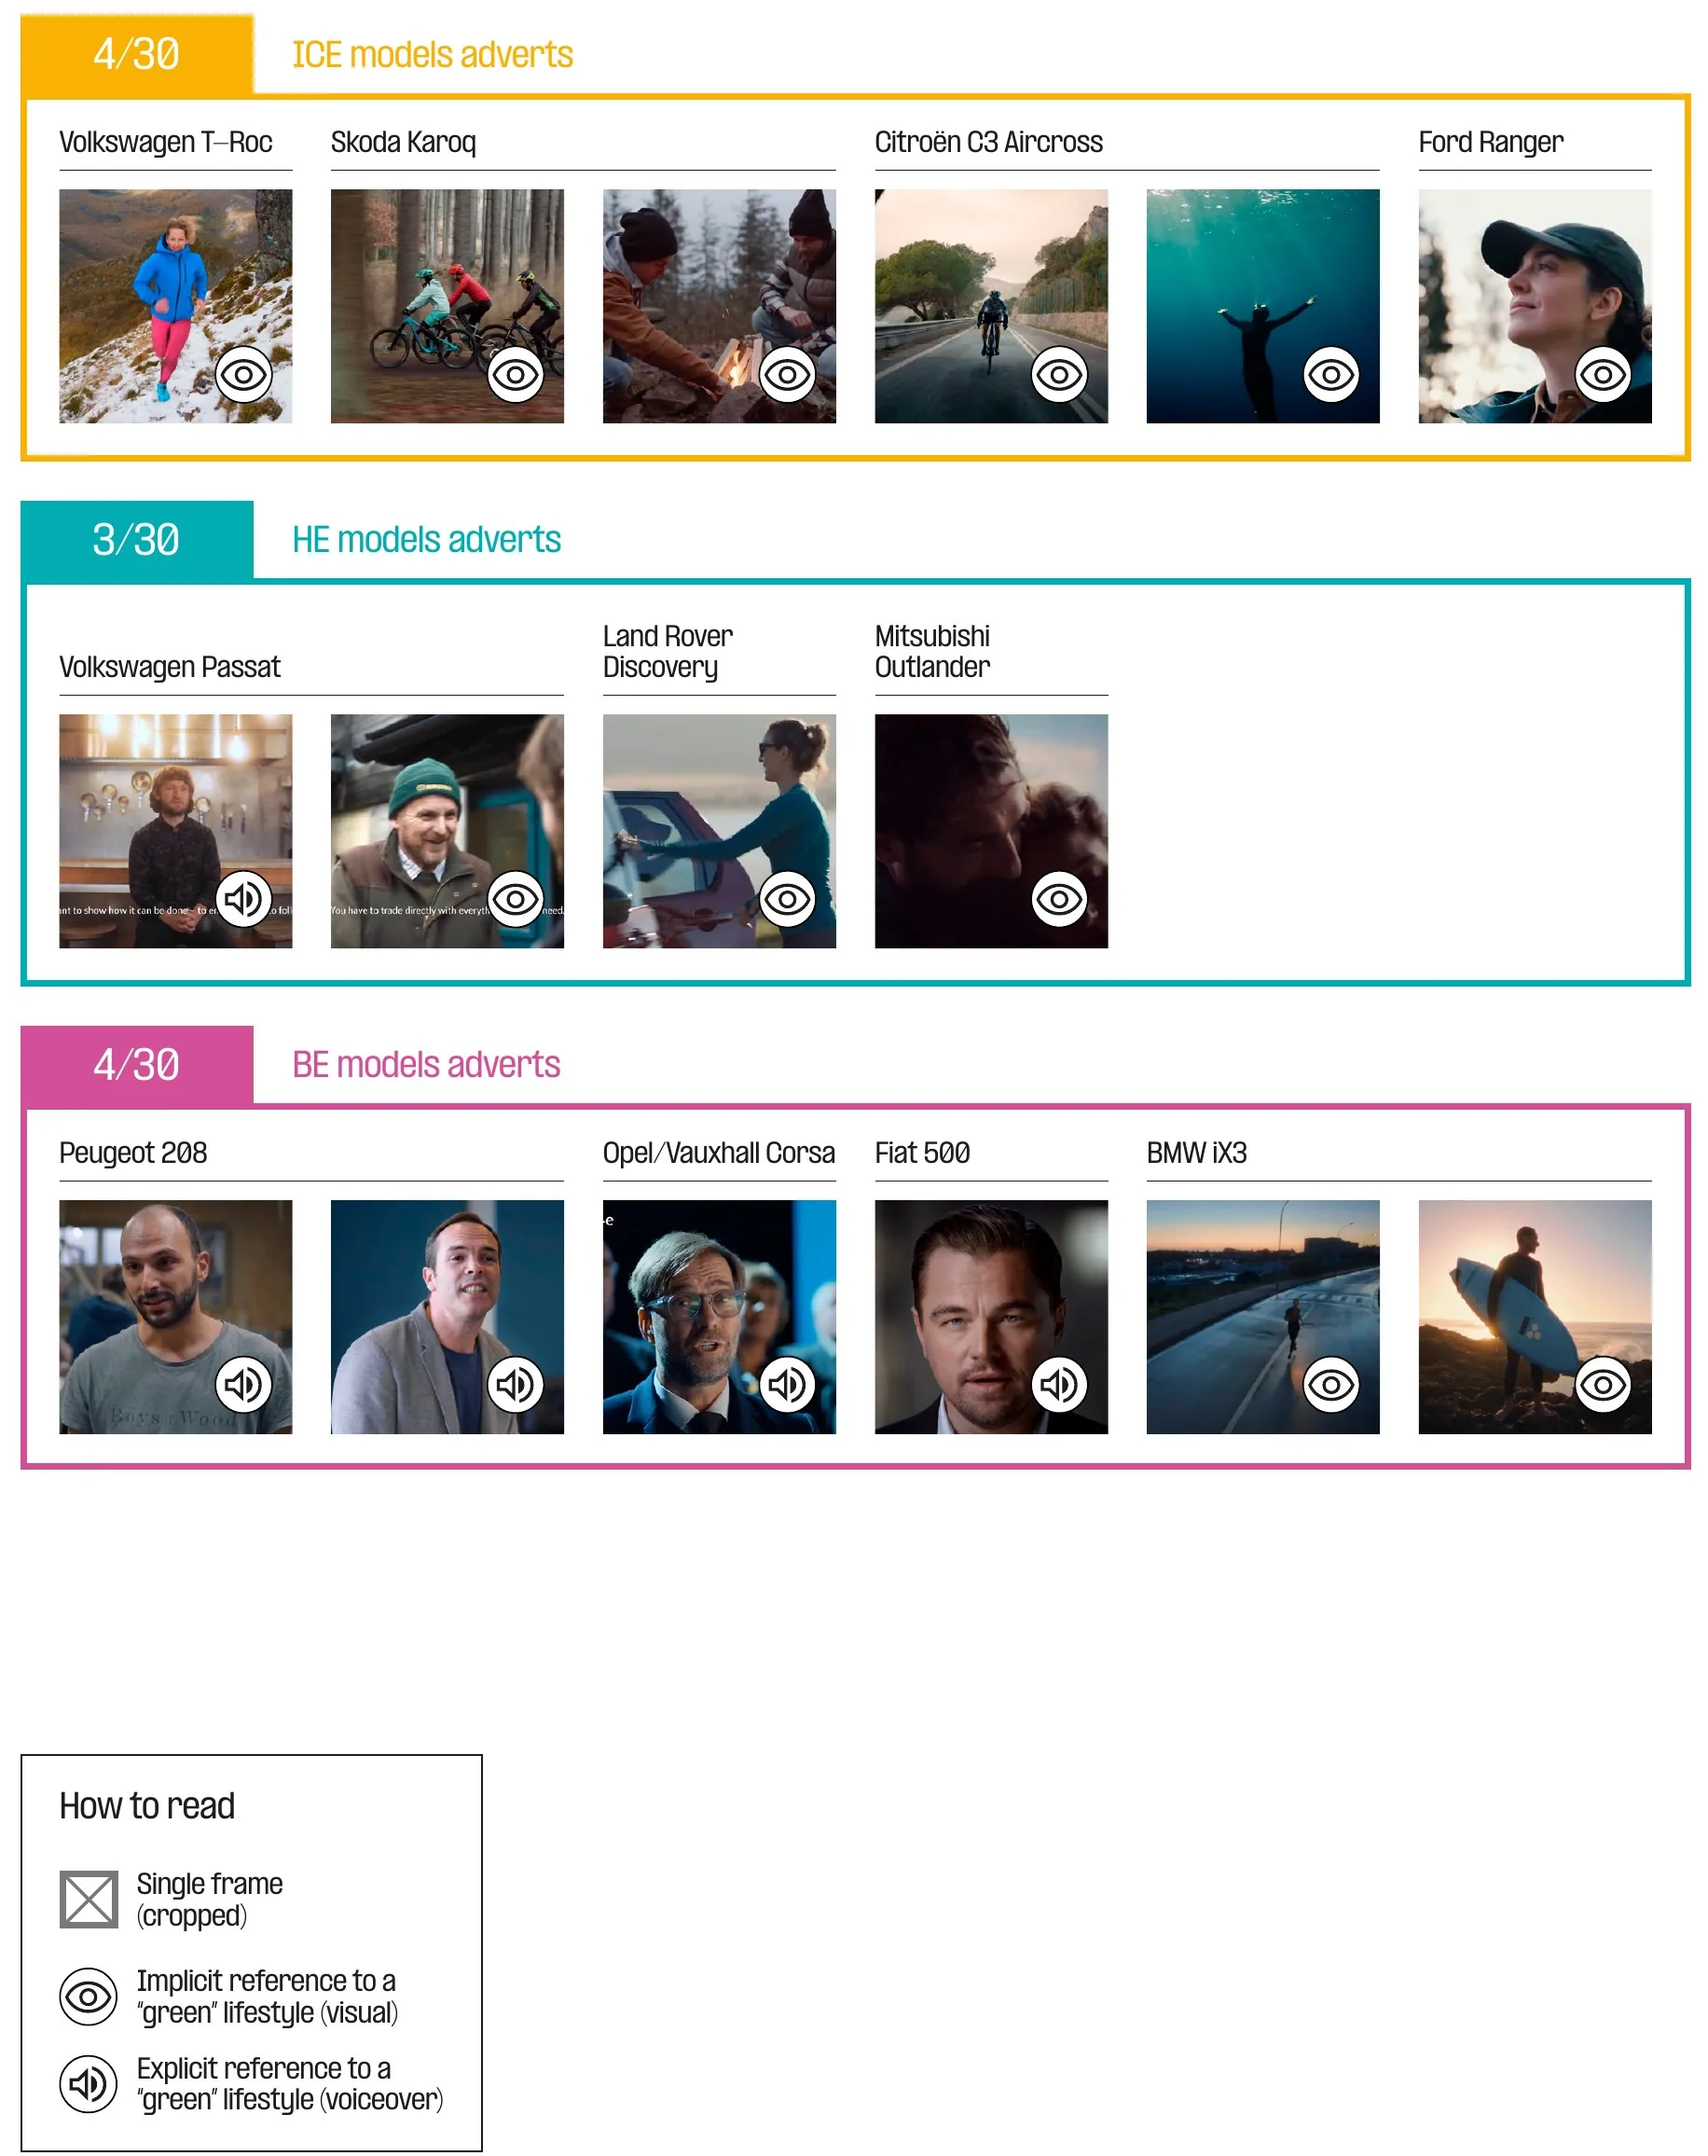
How to read · The eye icon marks an implicit, visual reference; the speaker icon an explicit one in the voiceover.
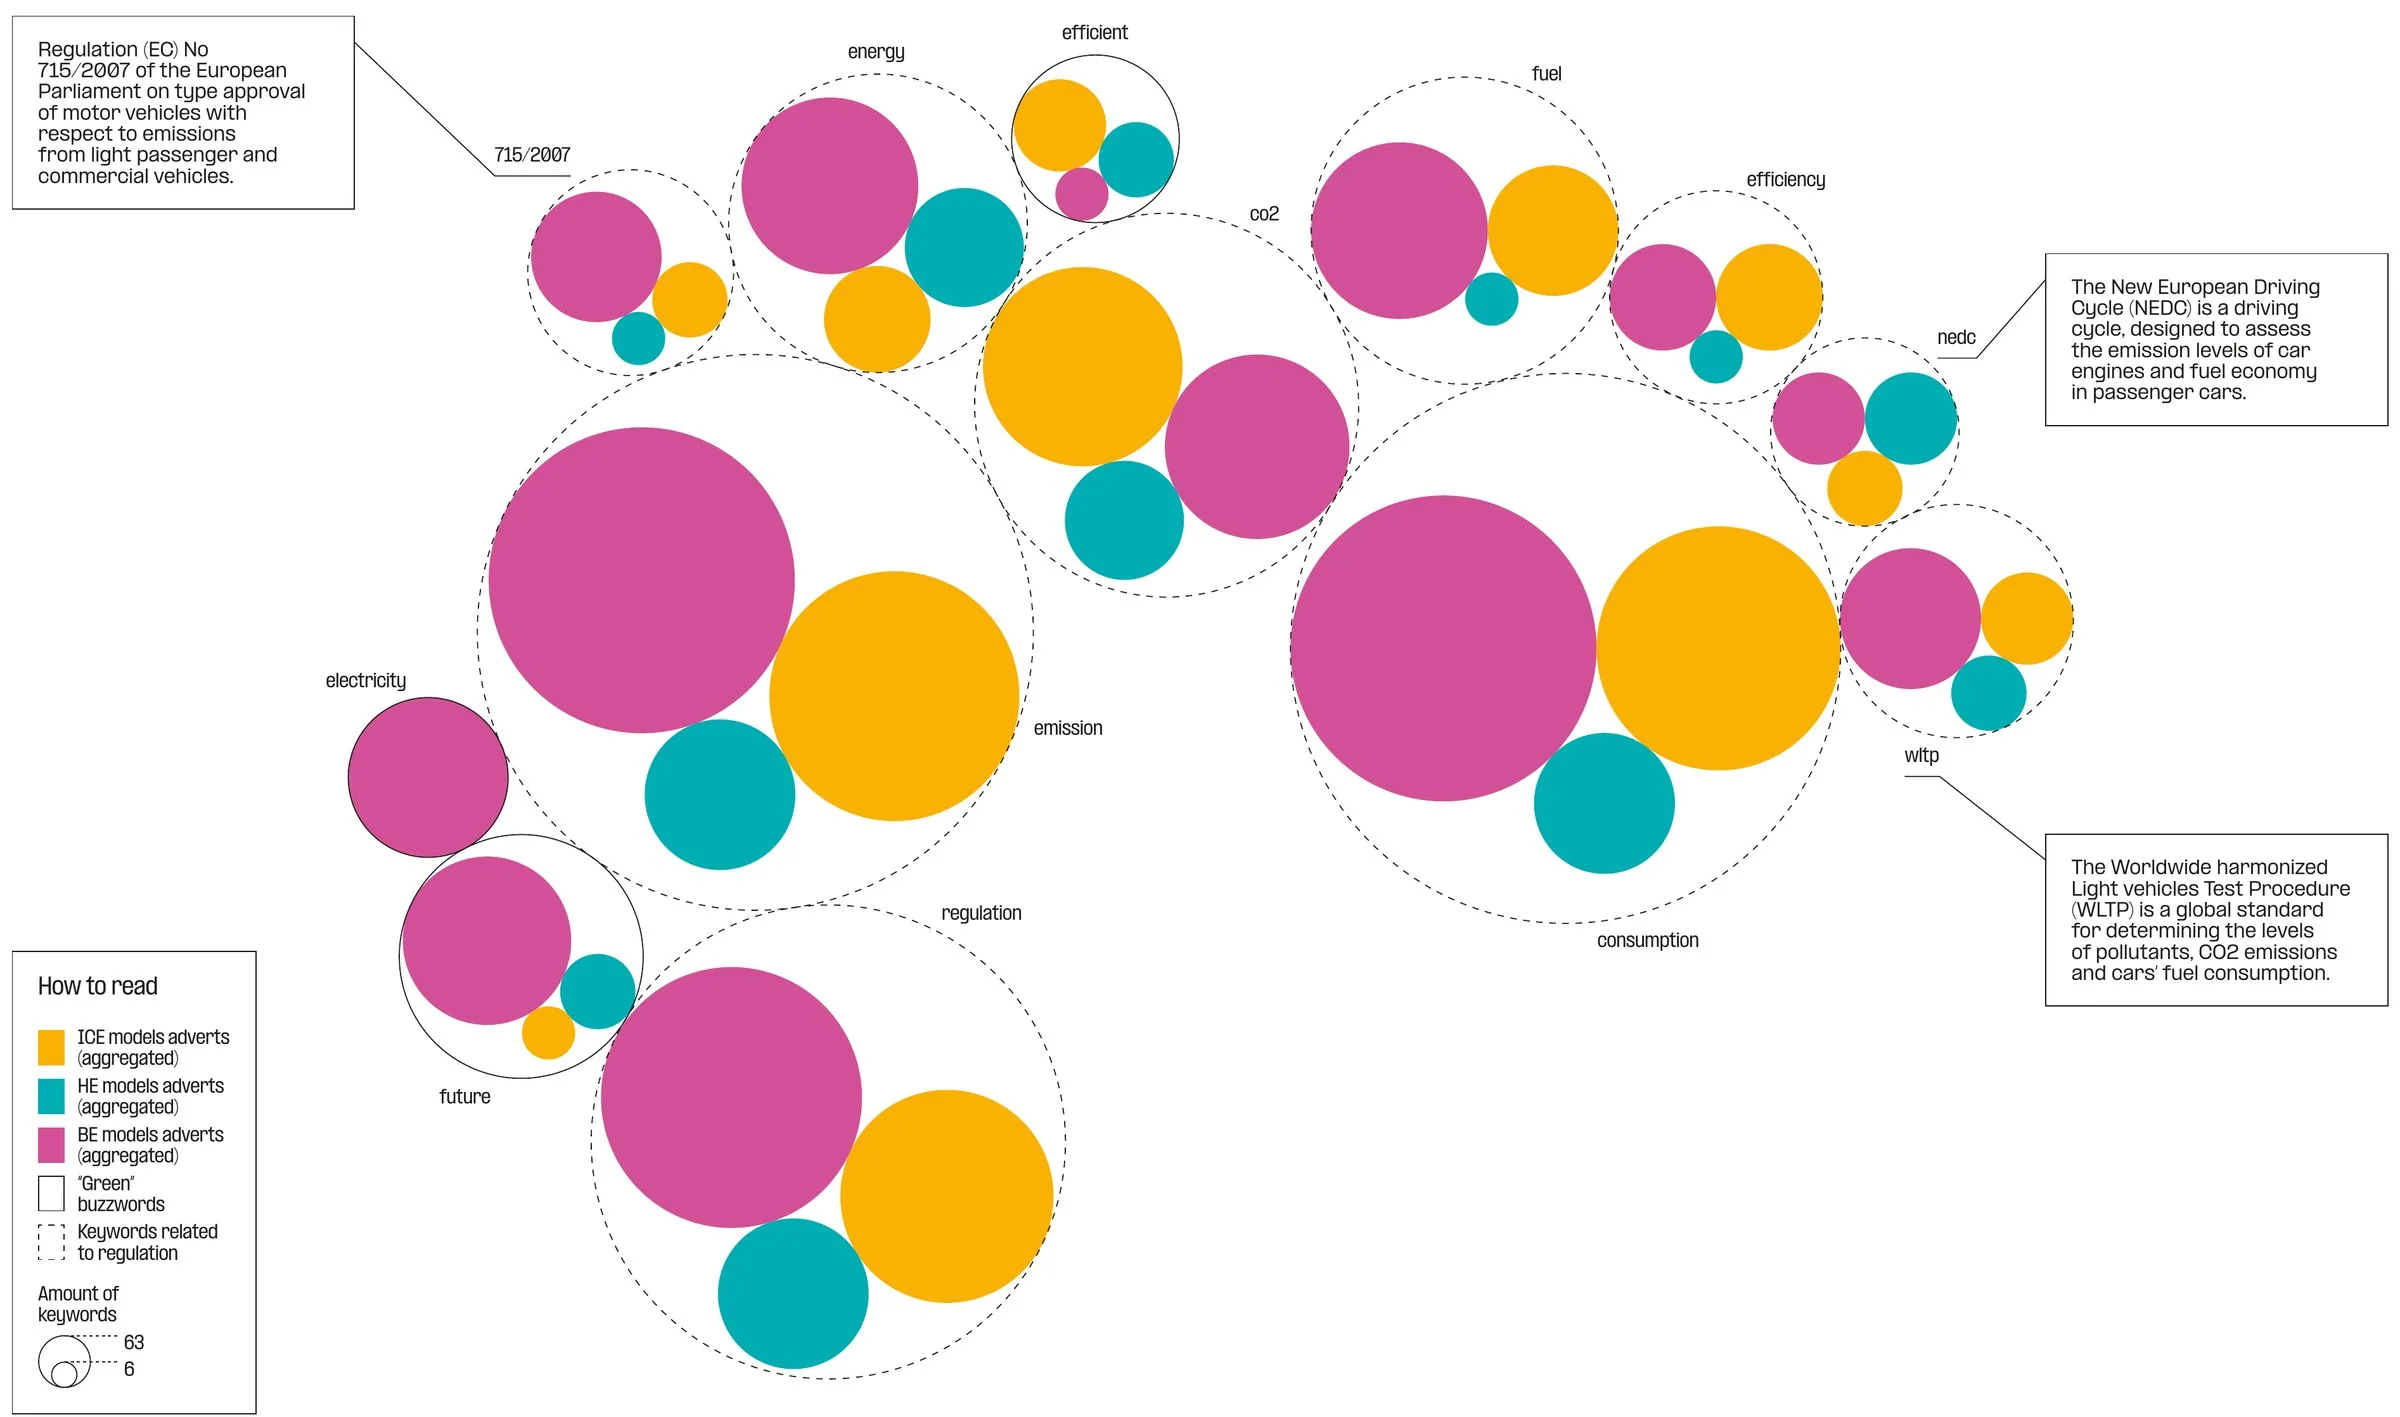
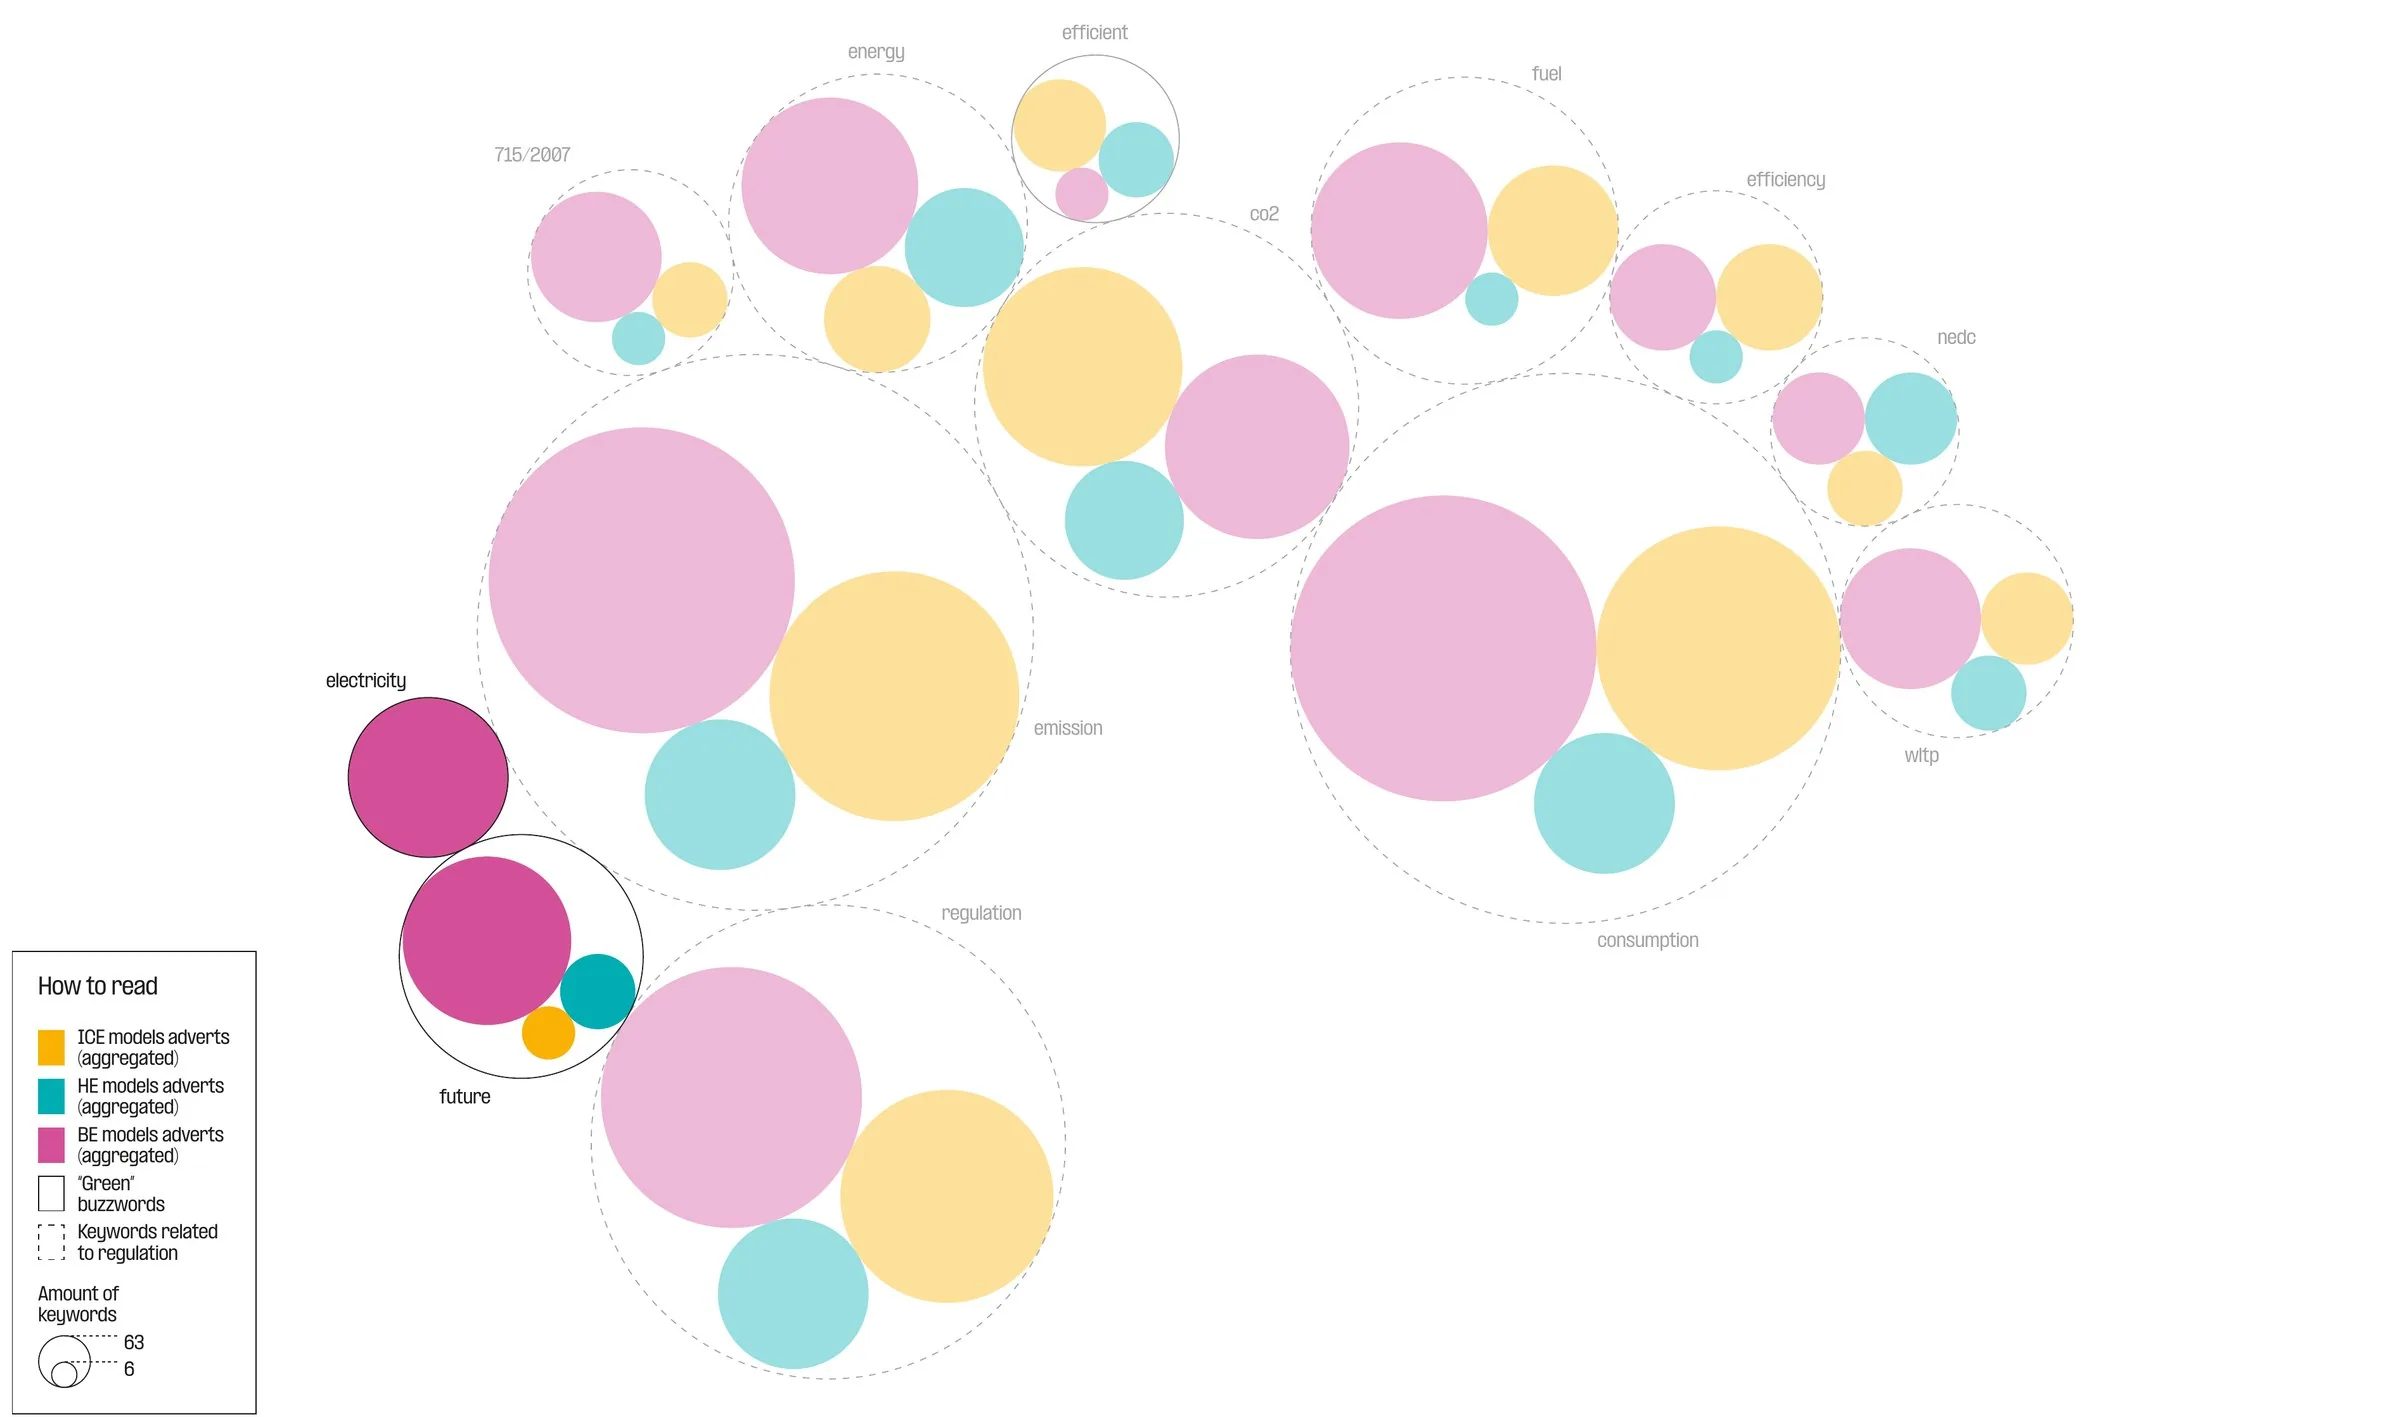
How to read · Each group is one keyword, its inner circles the use per propulsion. Dashed outlines: regulation terms. Solid outlines: “green” buzzwords.
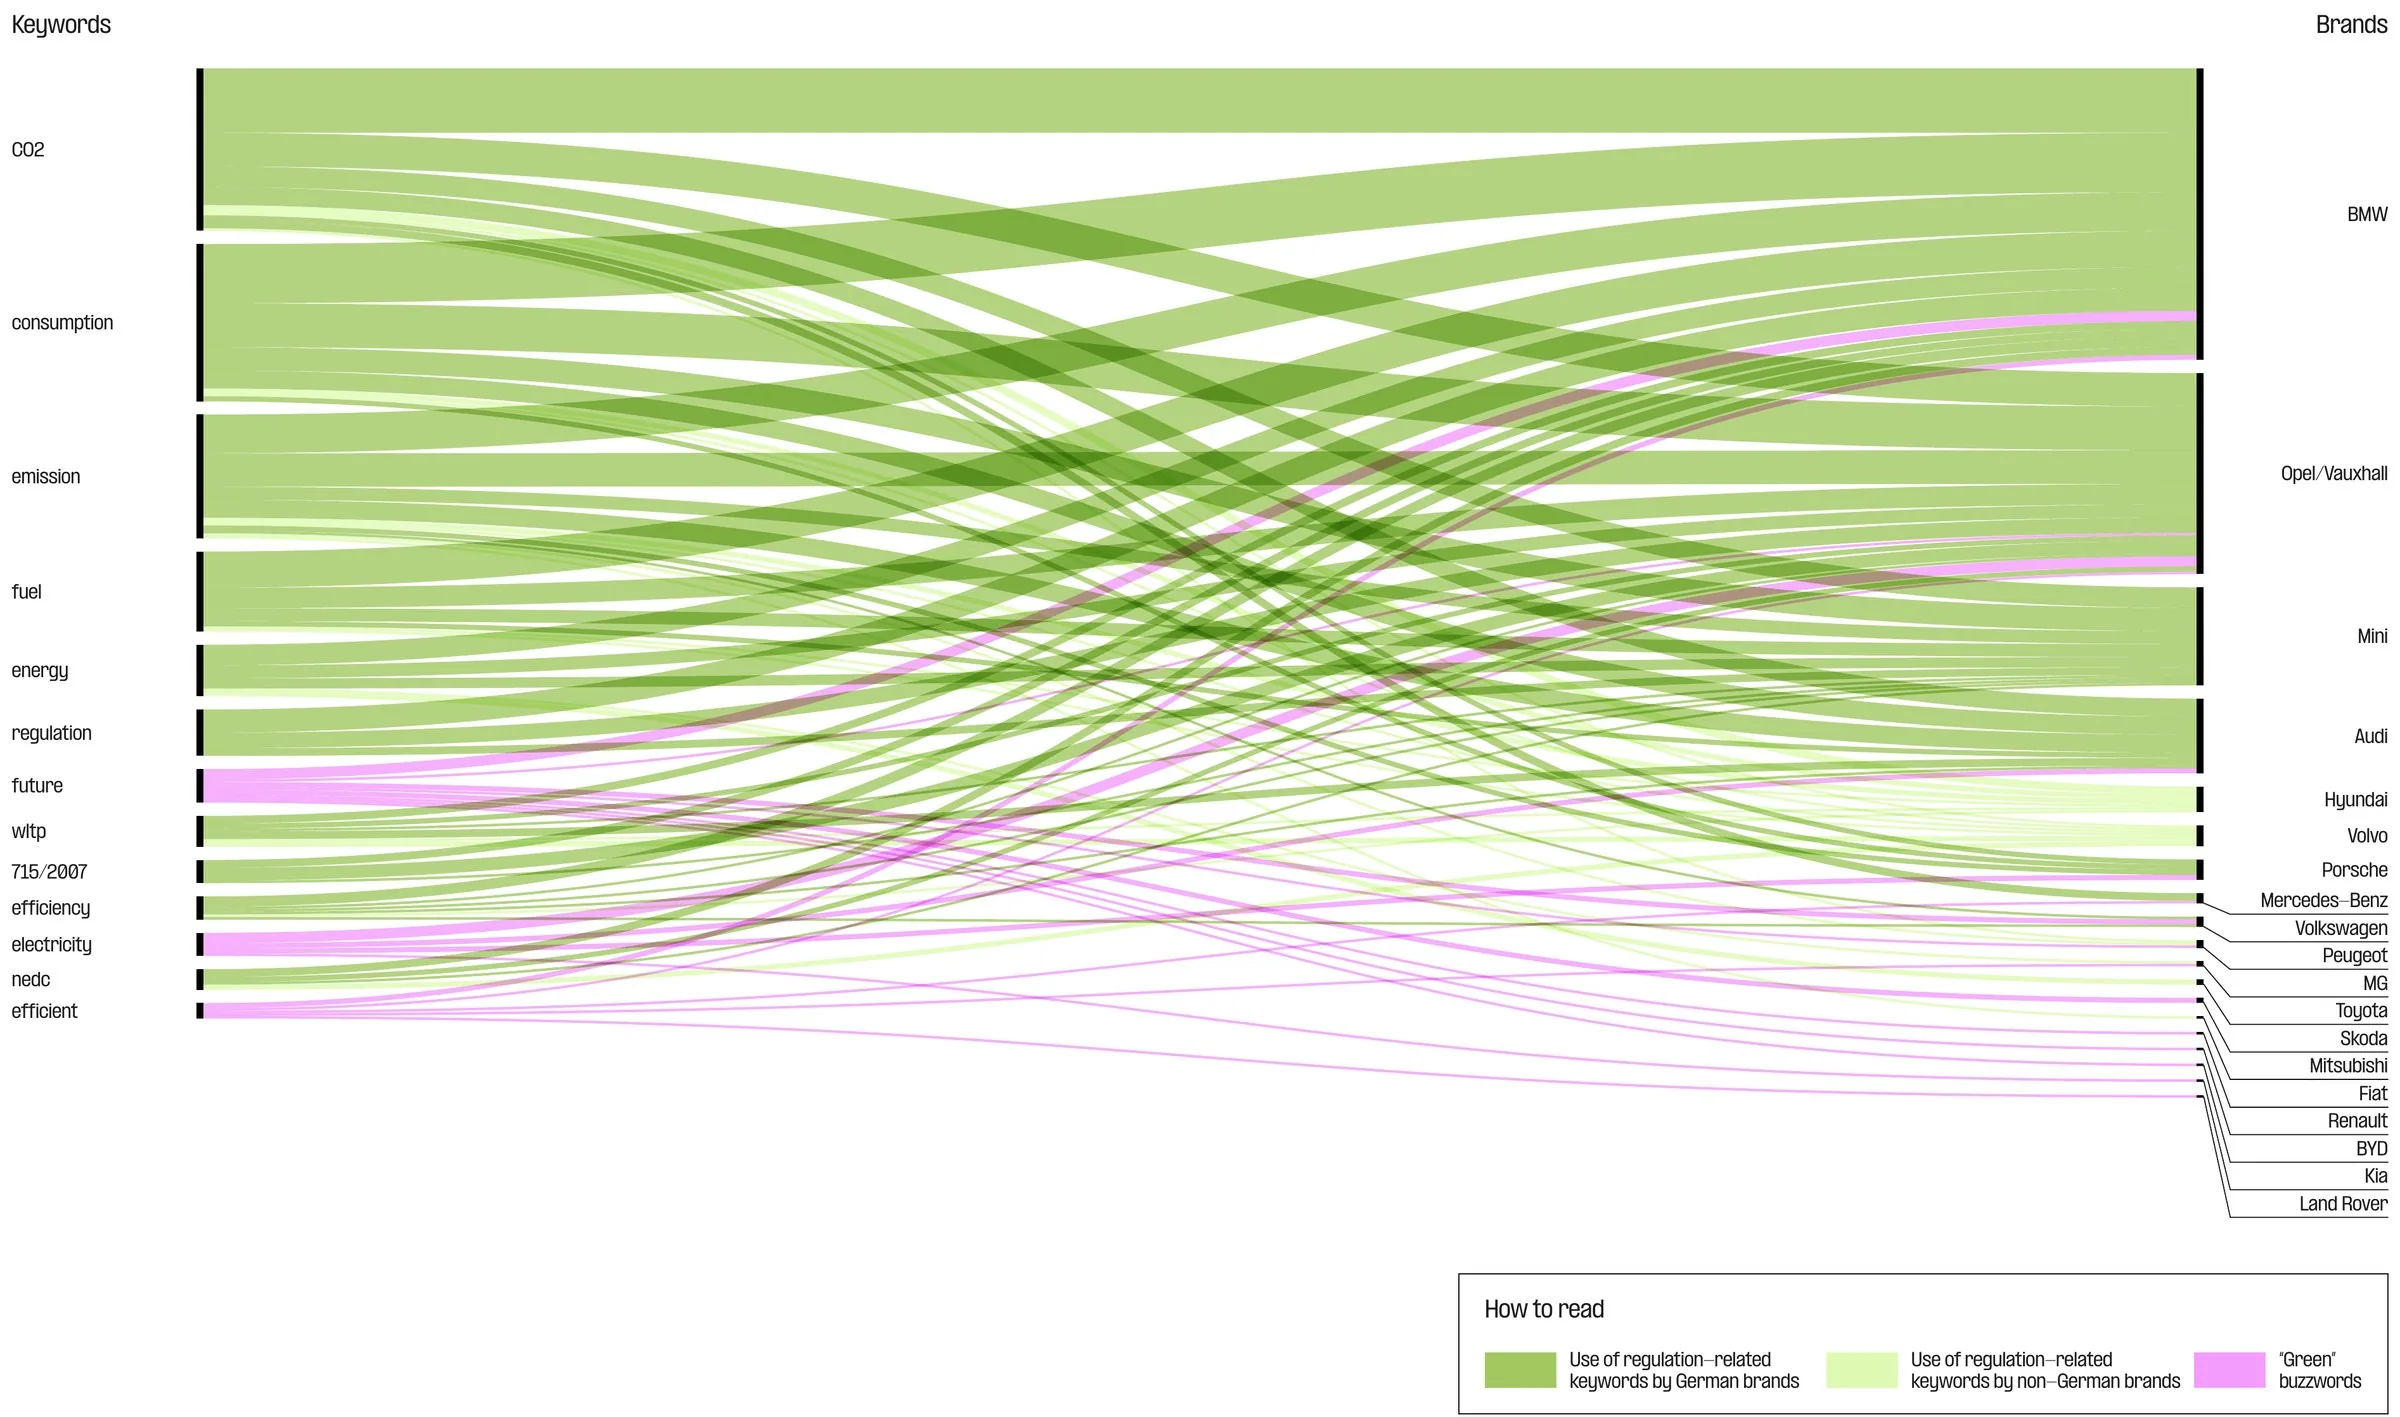
How to read · Dark green: regulation keywords by German brands; light green: other brands; pink: “green” buzzwords.
- Q1 · Environments
- Q2 · Narrative strategies
- Q3 · Descriptions
Method, glossary and protocols
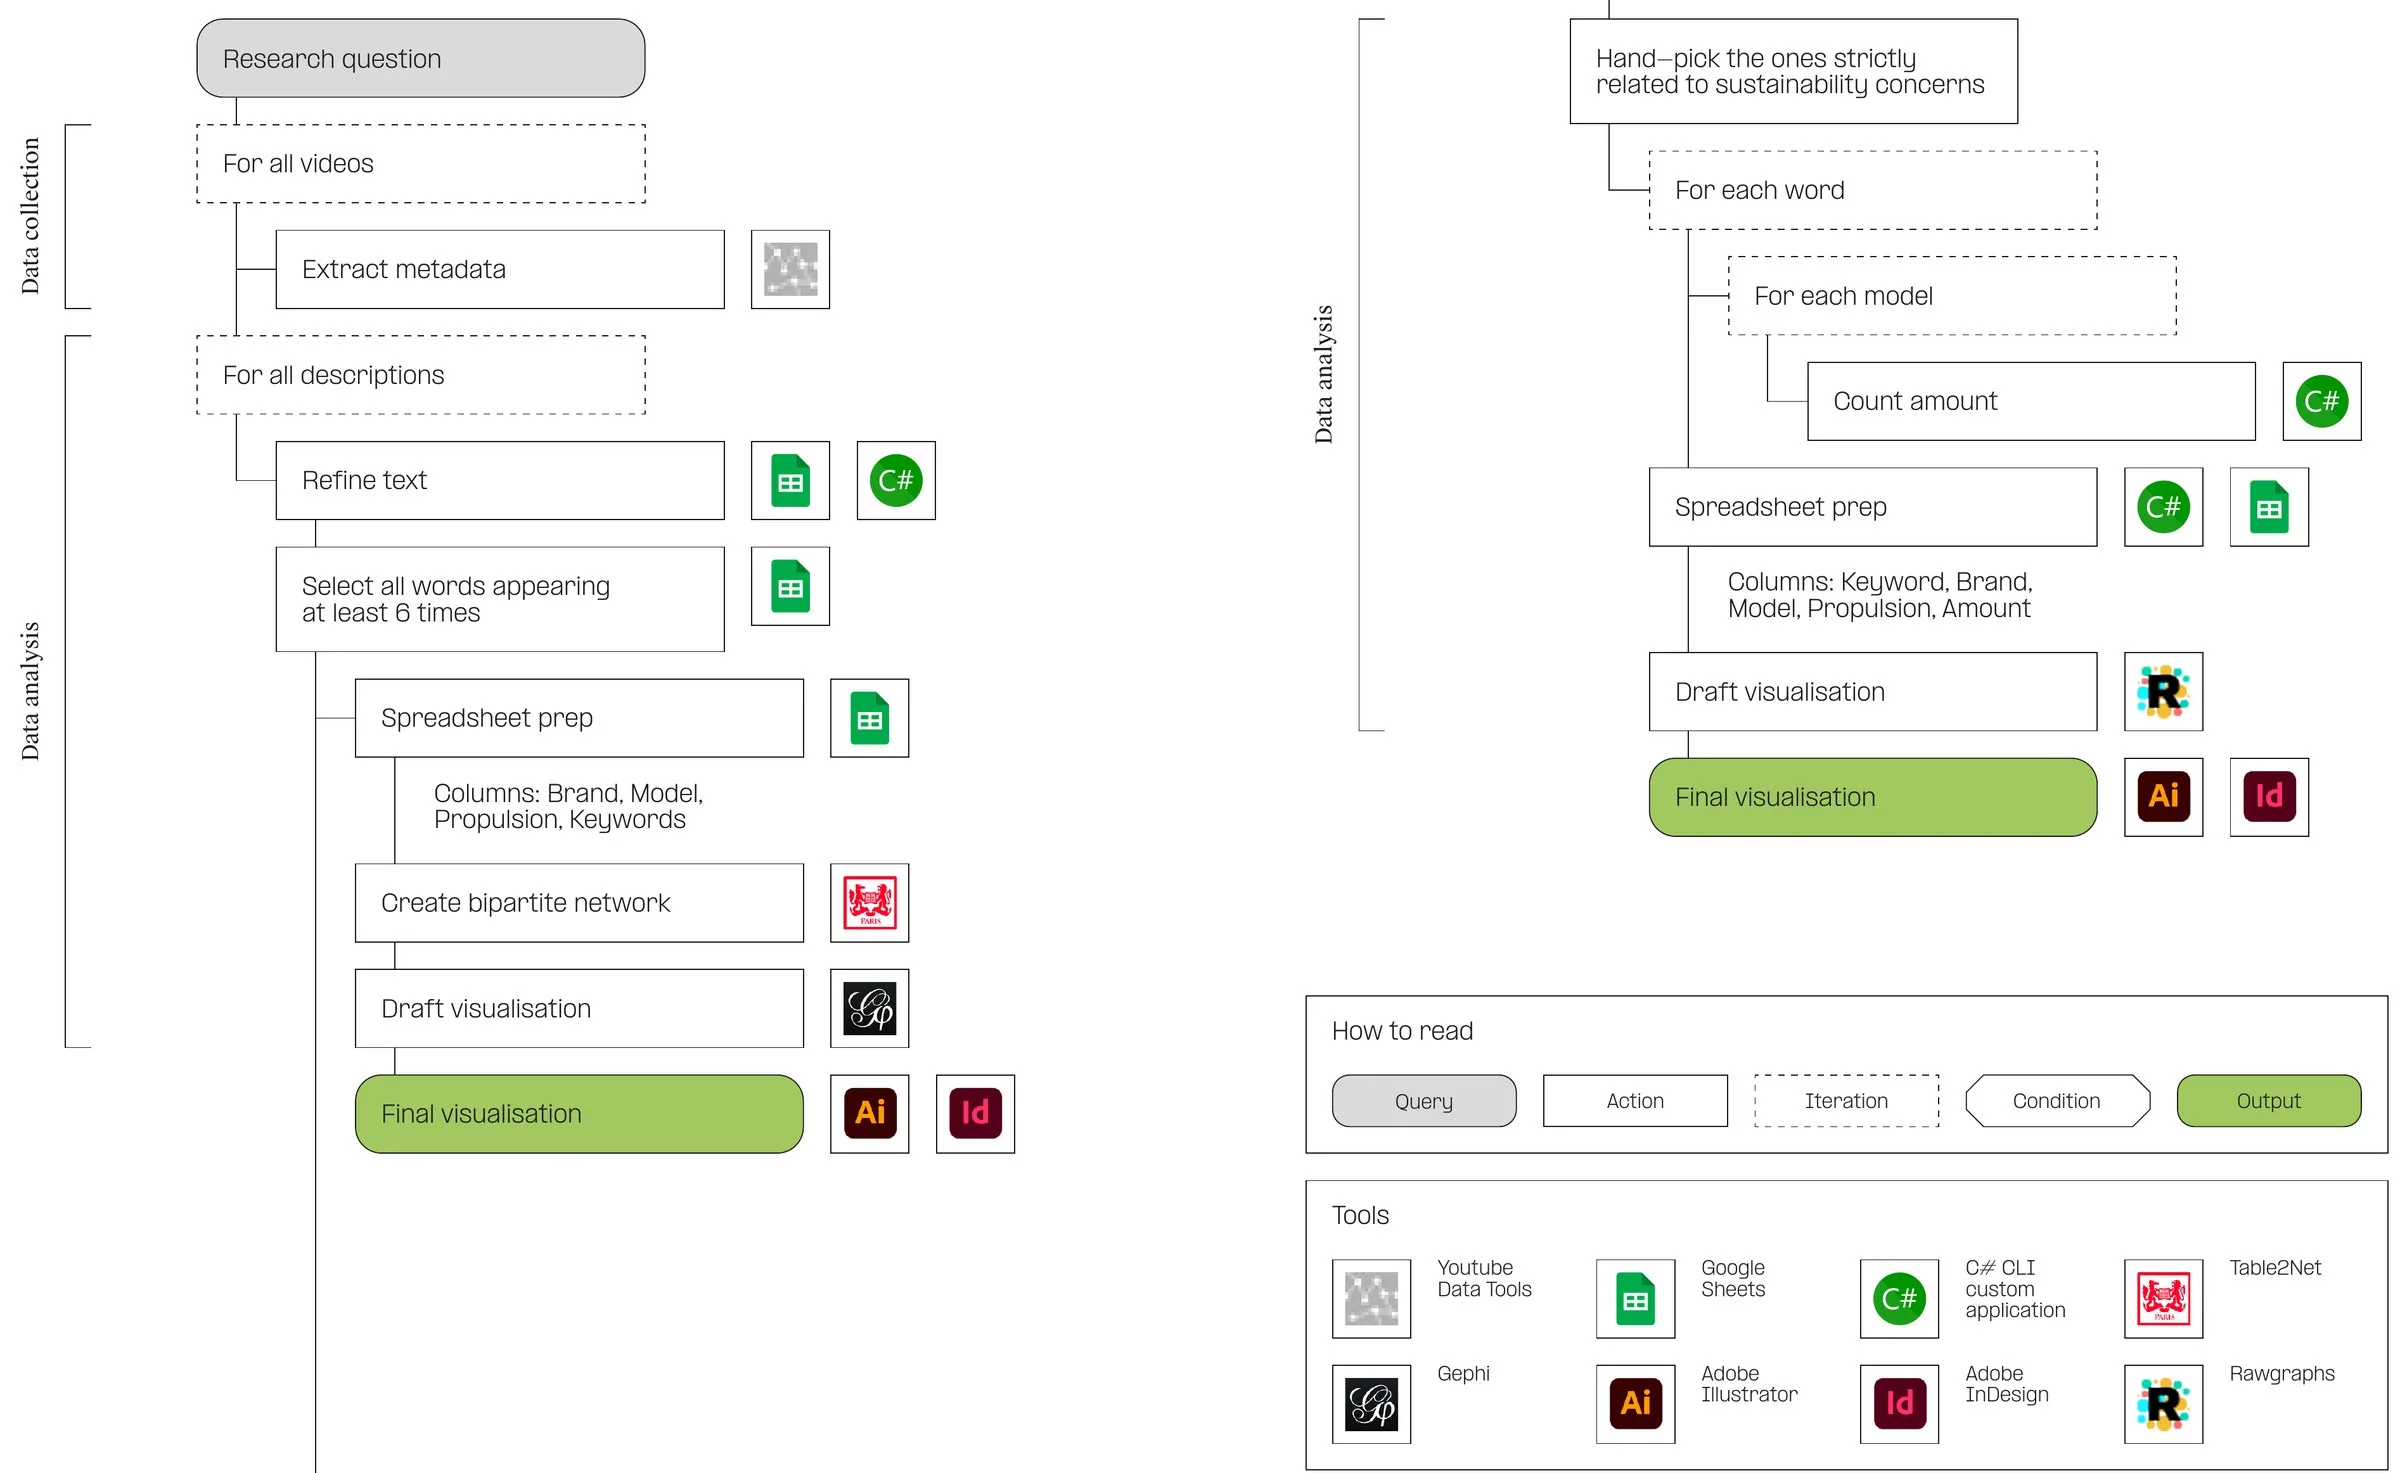
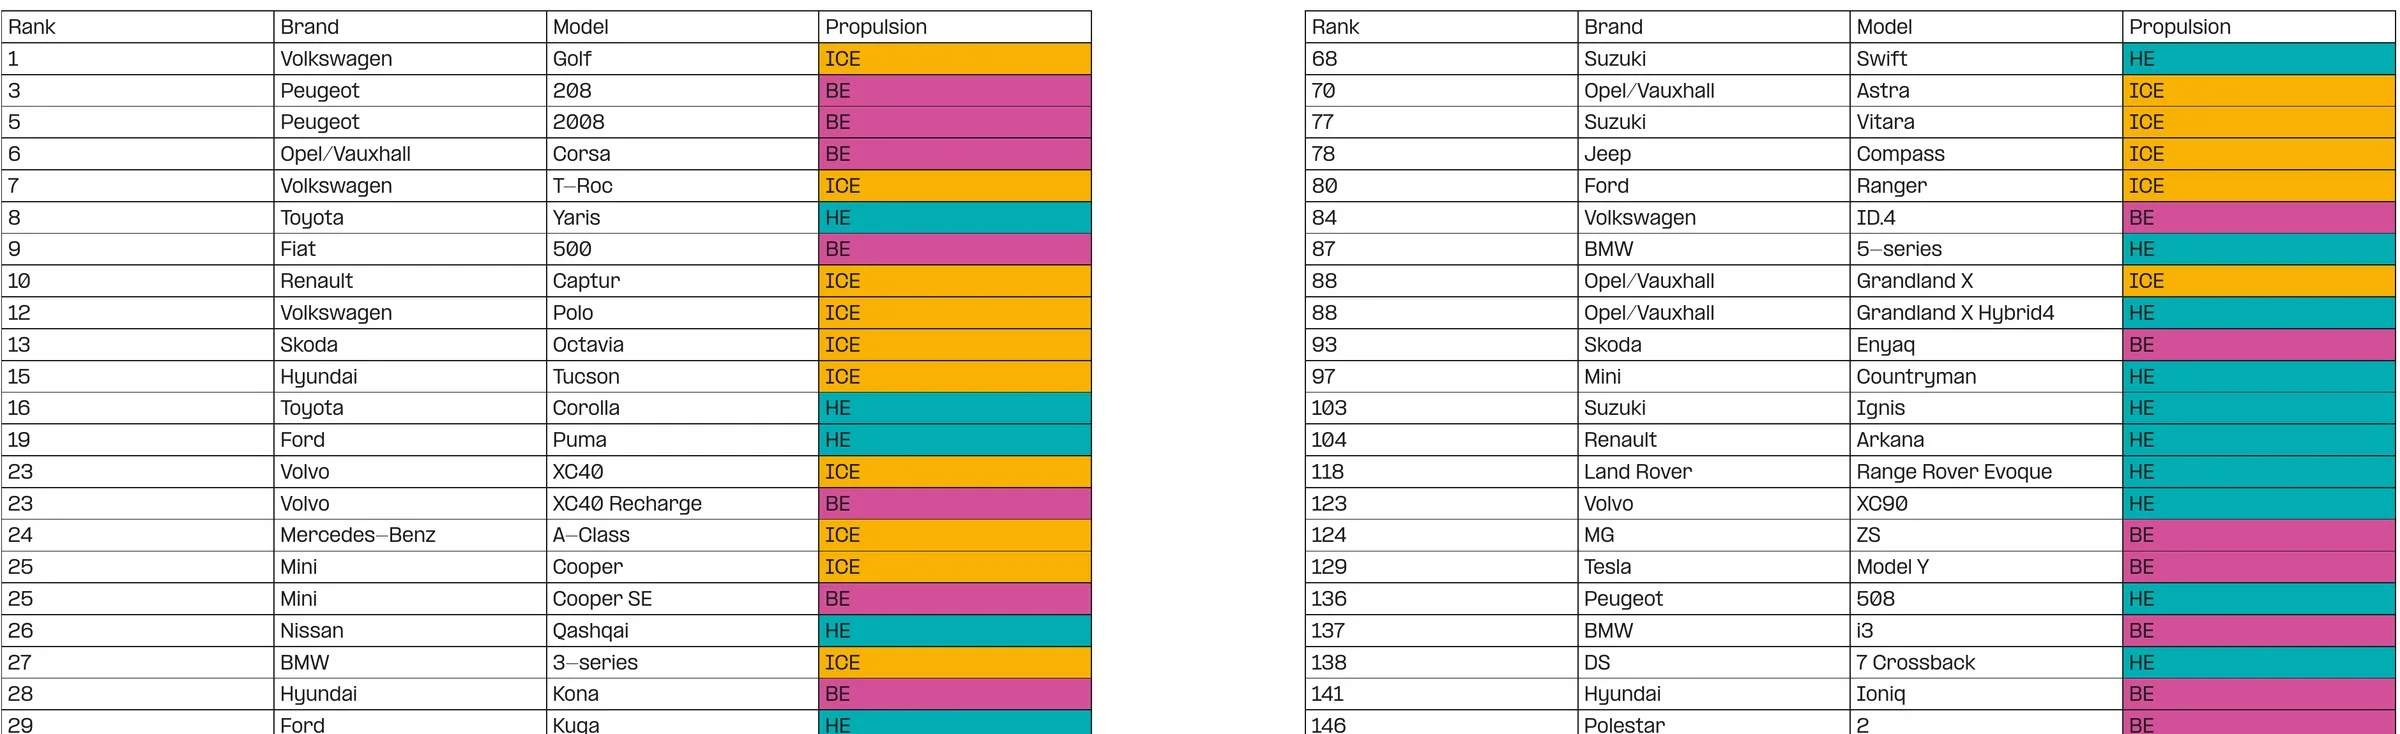
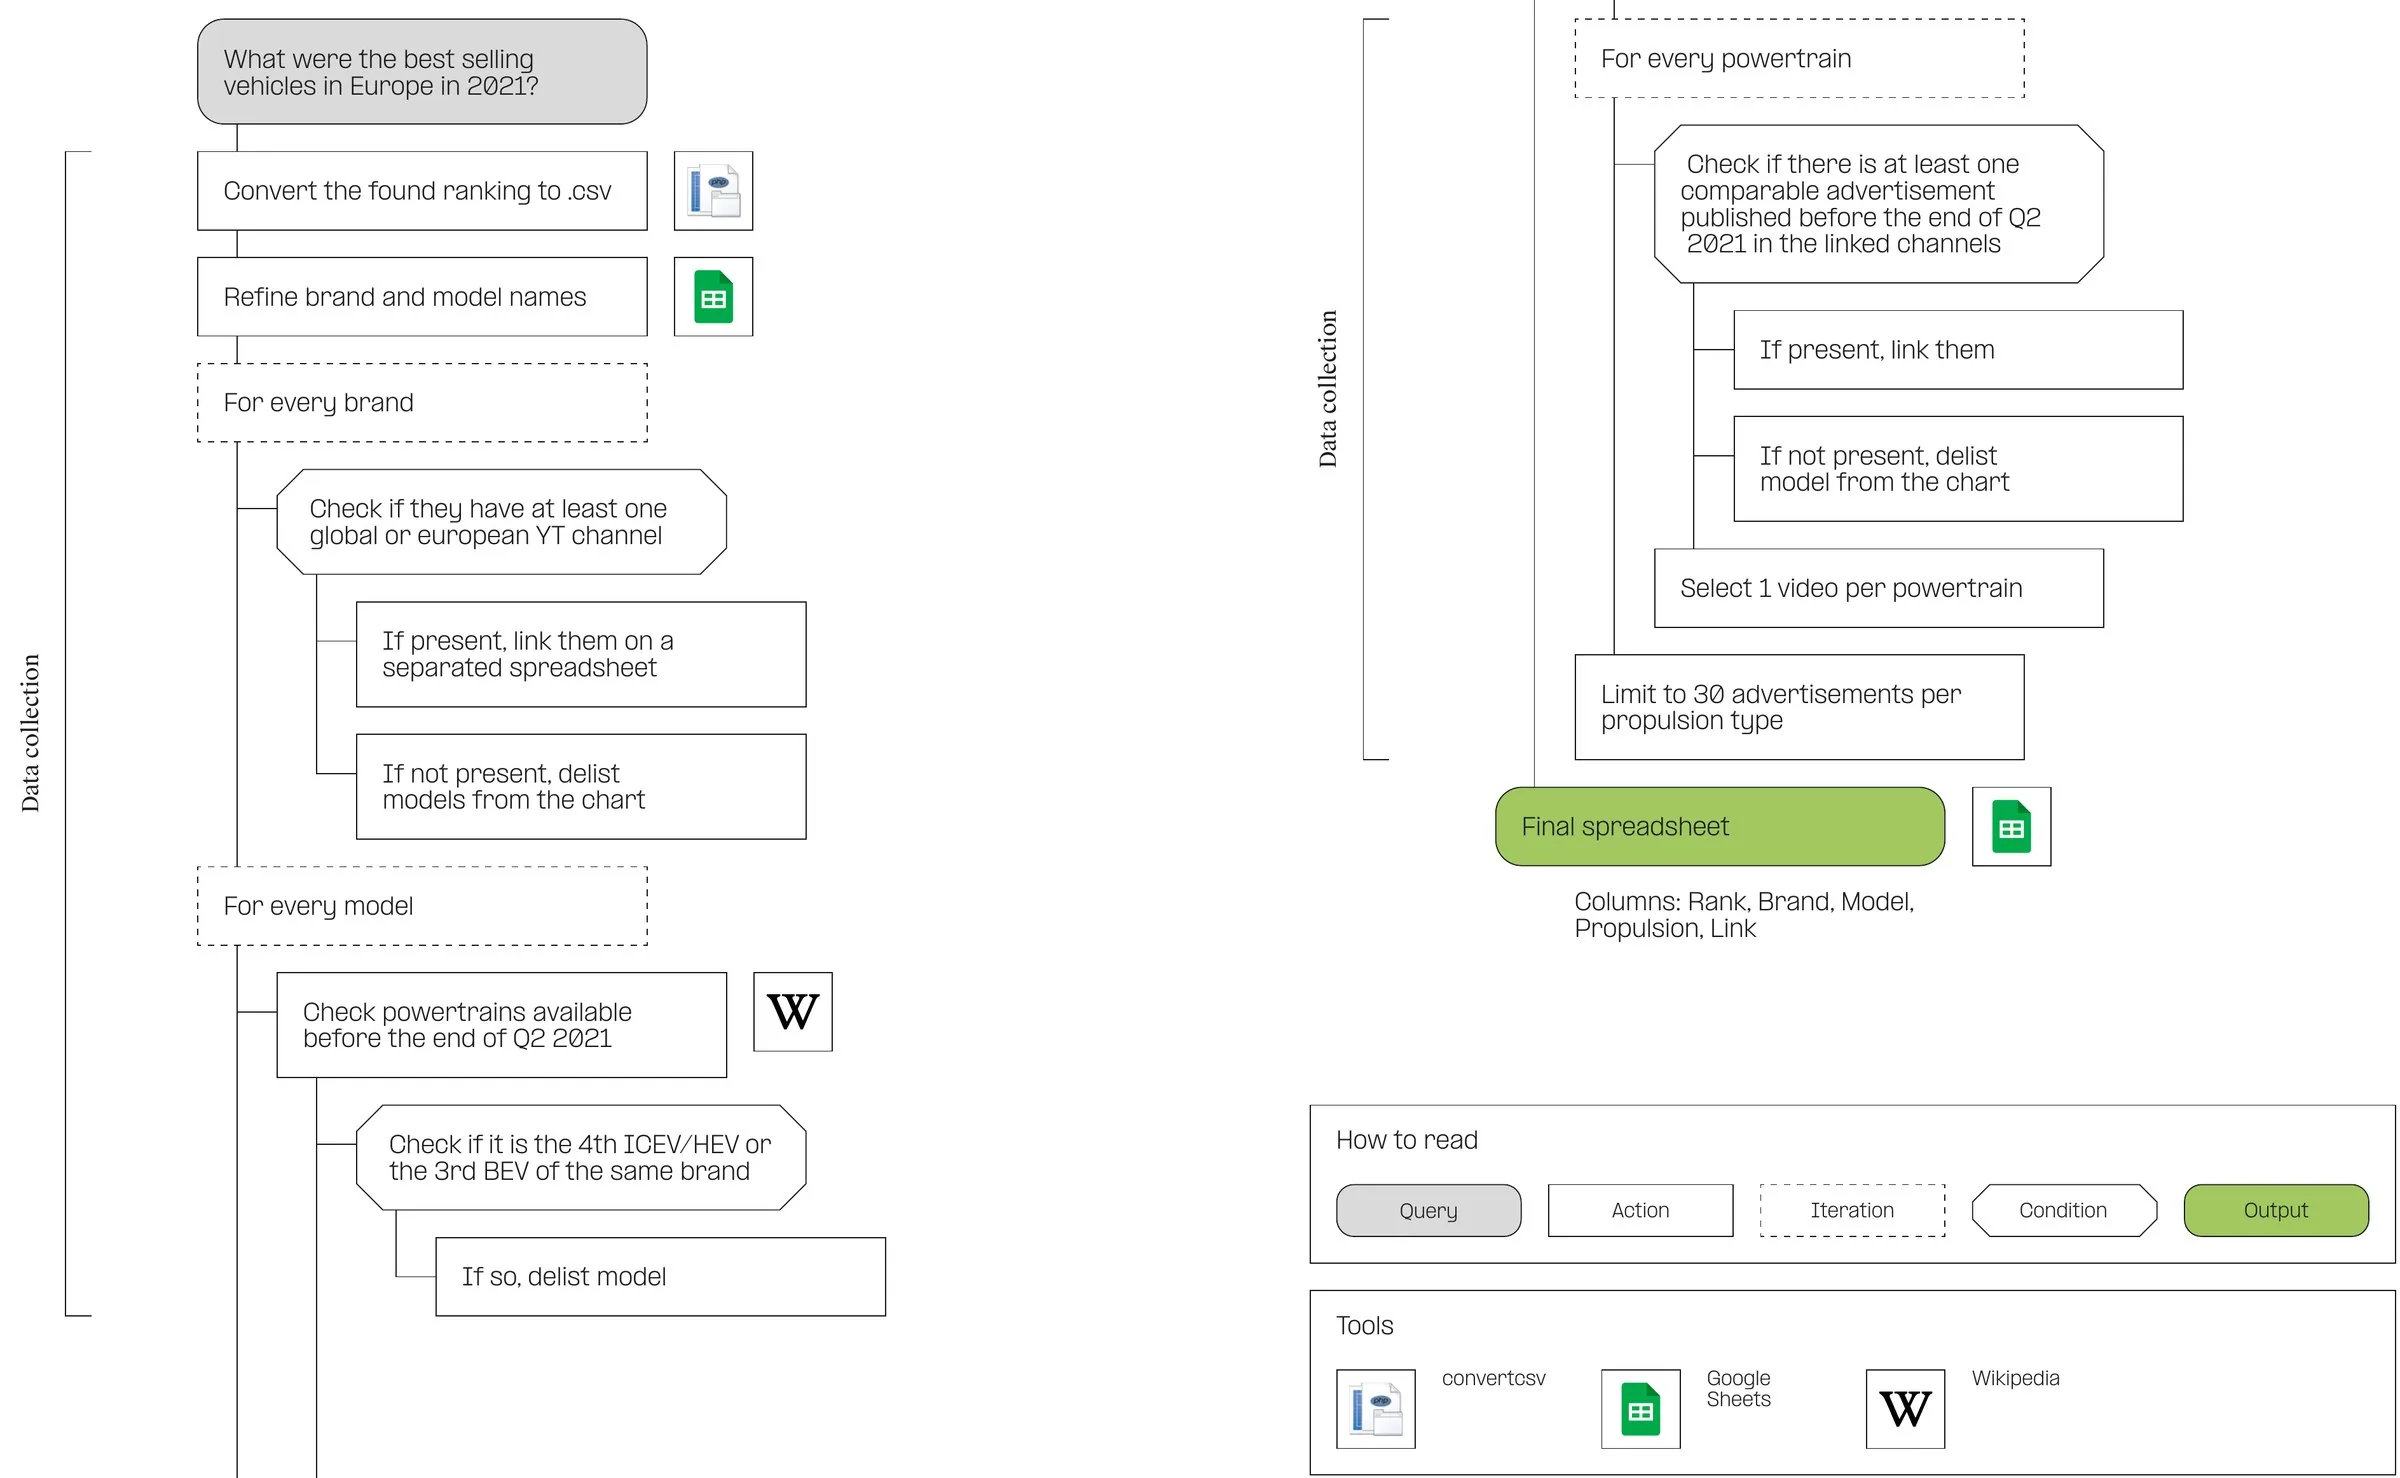
From a ranking of all models sold in Europe in 2021, we kept brands with a global or European YouTube channel, checked which powertrains existed before the end of Q2 2021, and capped each brand at three petrol or hybrid models and two electric ones.
- ICE / ICEV
- Internal combustion engine (vehicle): petrol or diesel
- HE / HEV
- Hybrid electric (vehicle)
- BE / BEV
- Battery electric (vehicle)
- NEDC / WLTP
- European and worldwide test procedures for emissions and fuel consumption
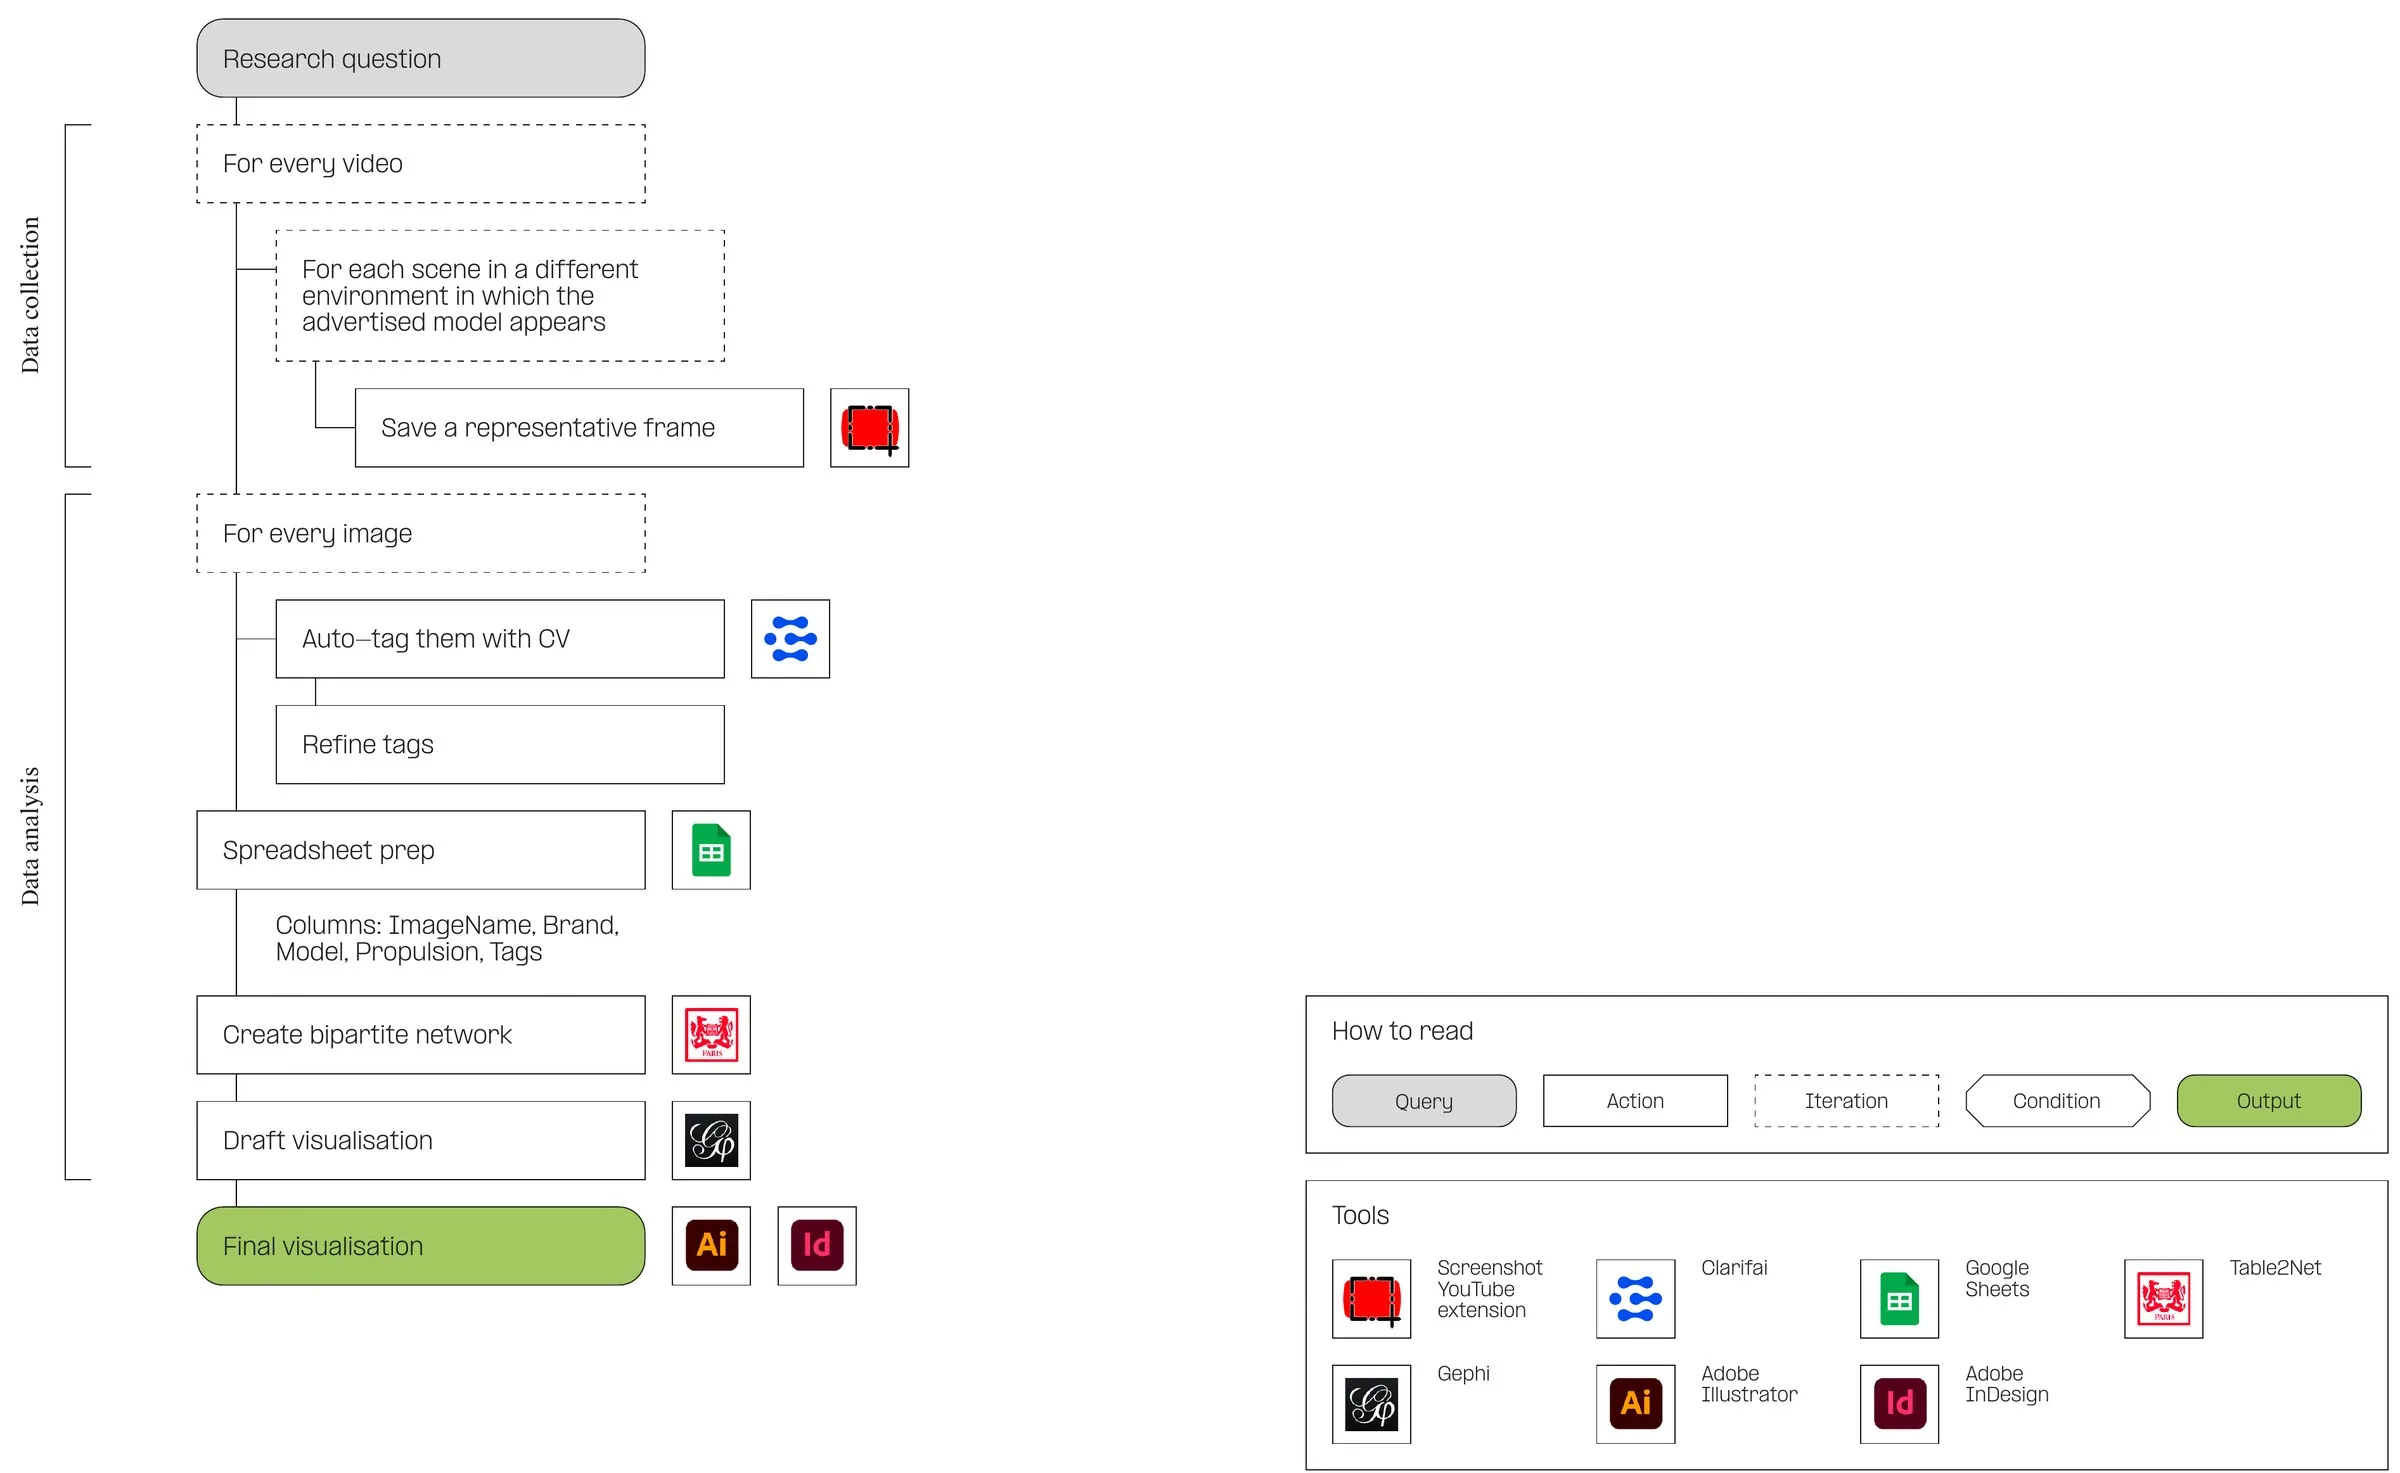
Question 01
Screenshot extension, Clarifai, Table2Net, Gephi
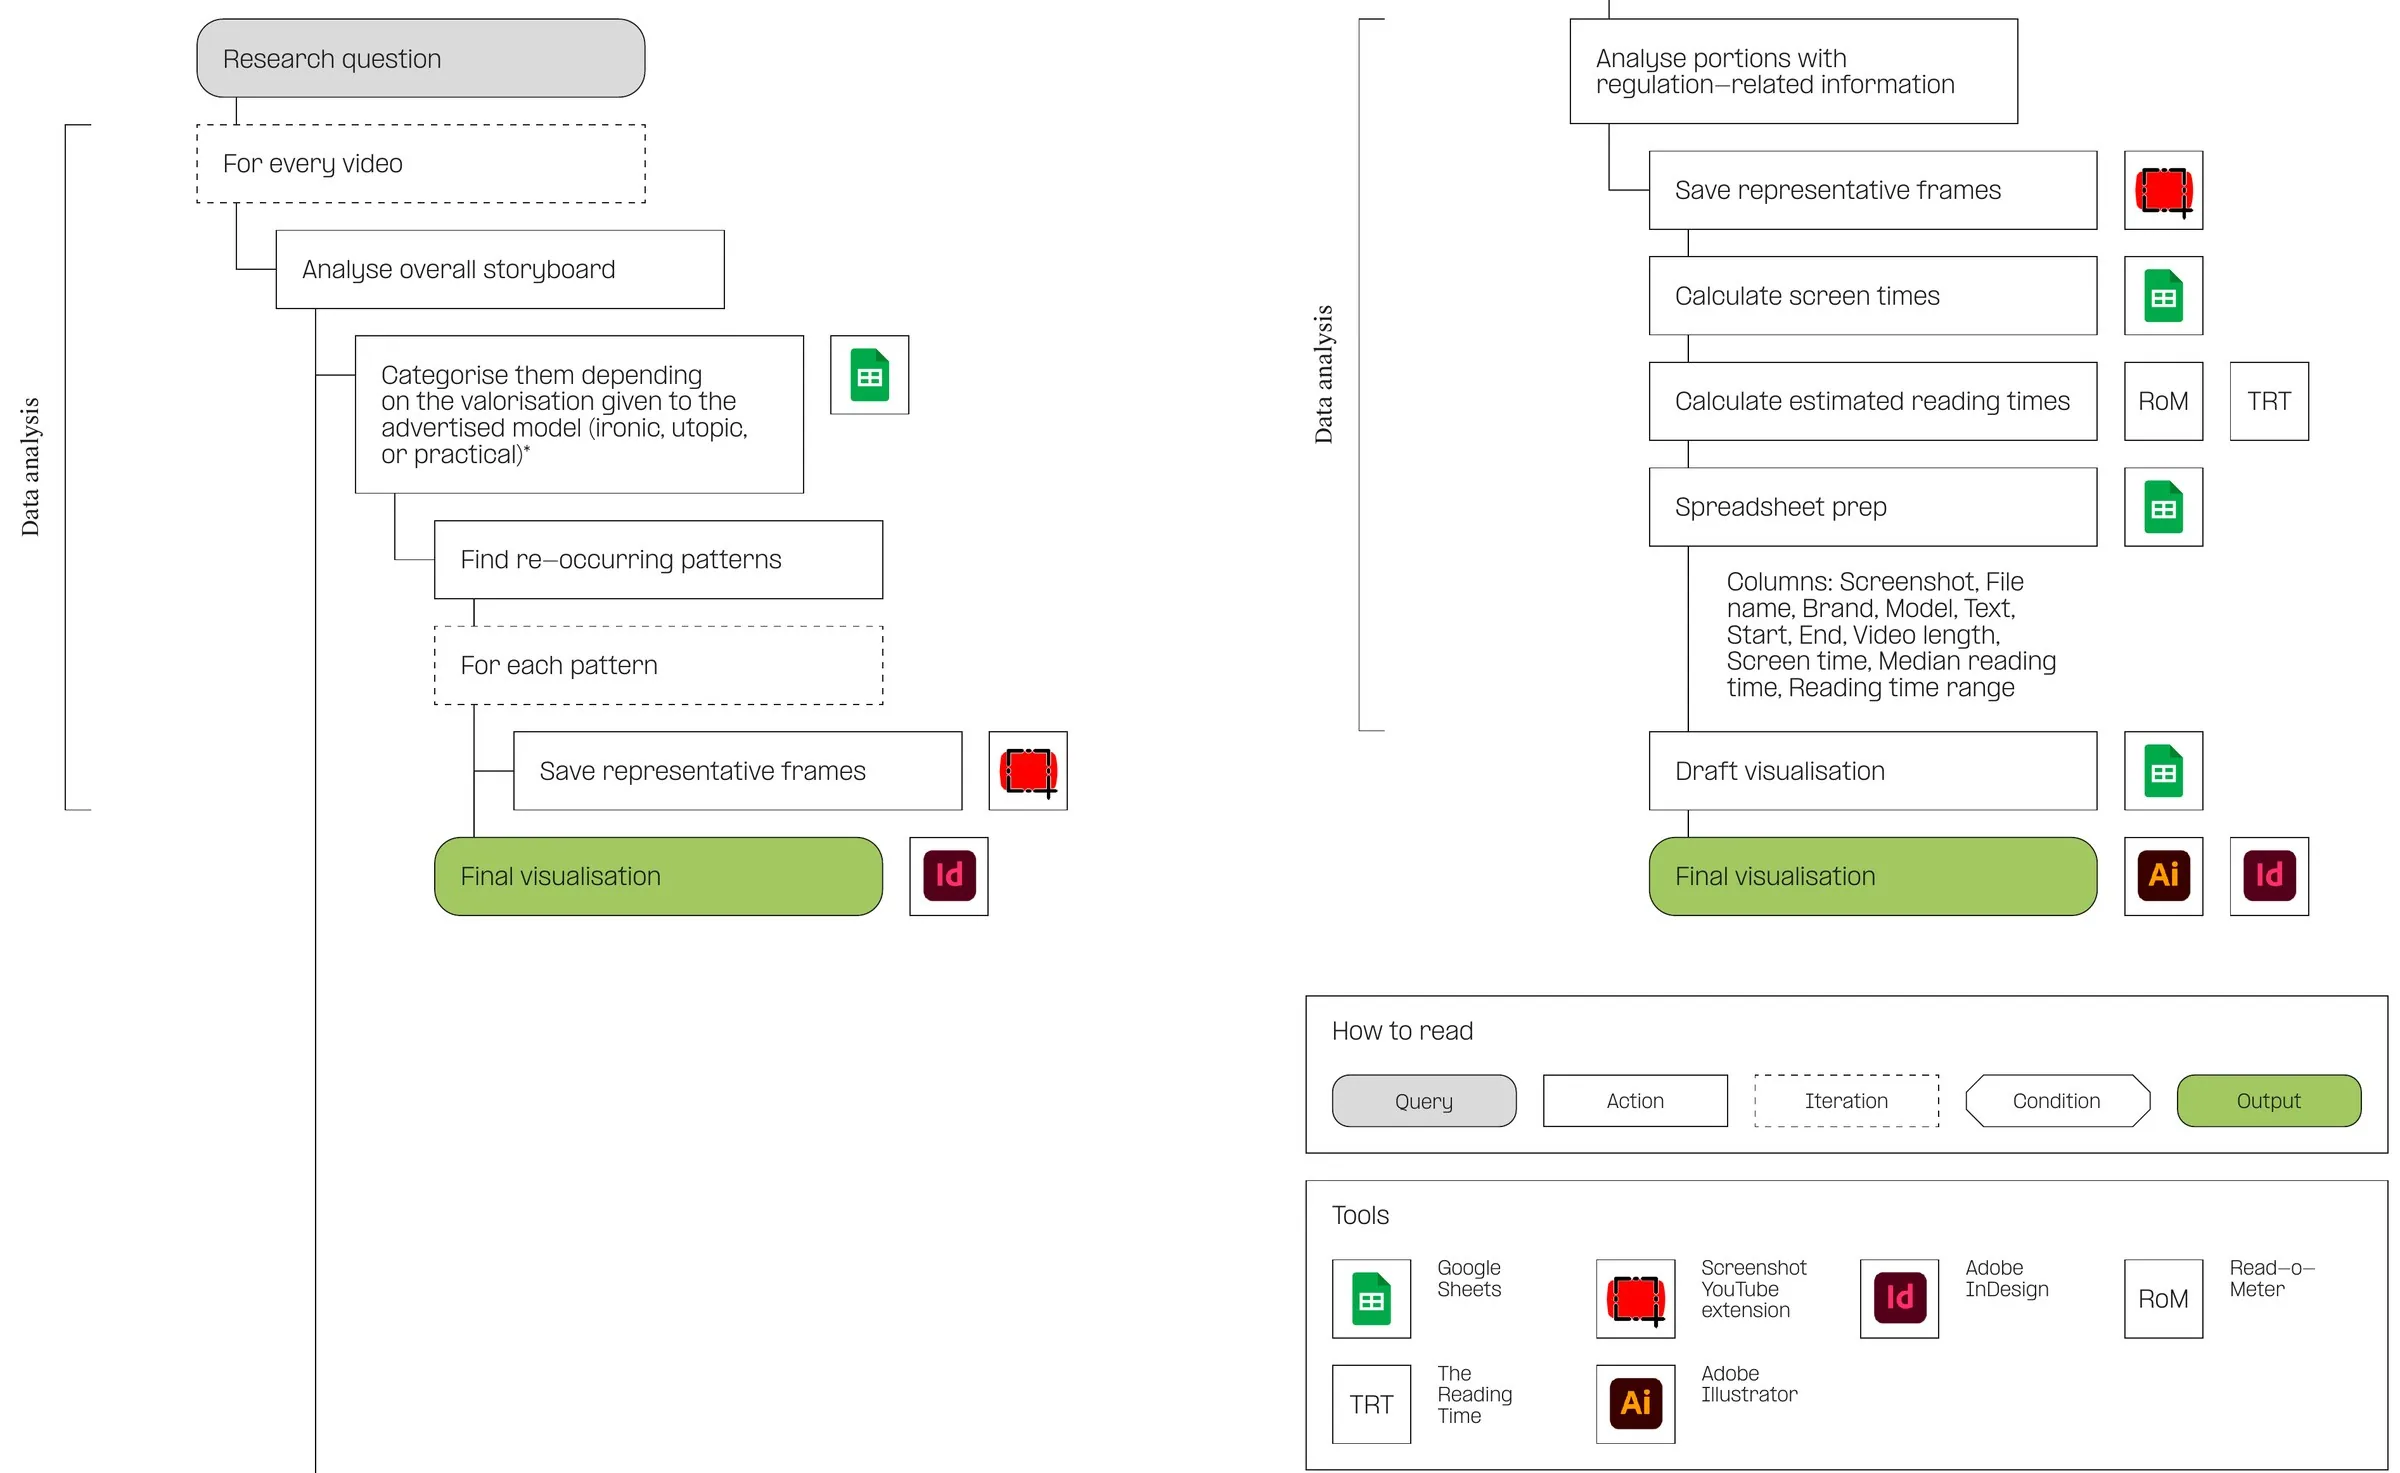
Question 02
Storyboards, Read-o-Meter, The Read Time
Question 03
YouTube Data Tools, custom C# app, RAWGraphs
06The report’s design
Three decisions to make dense evidence readable at a glance.
The report had to hold every finding without becoming a wall. Our team agreed on three rules and applied them on every page.
07From findings to videos
The report was written for experts. To reach drivers, we needed fewer patterns and no reading.
We picked four recurring patterns, the ones most clearly tied to greenwashing, and turned each into a video. Car as the solution and the written descriptions stayed in the report. The video counts below are out of all 90 adverts.
Automotifs · the website
Take each pattern out of its advert, and it stops working.
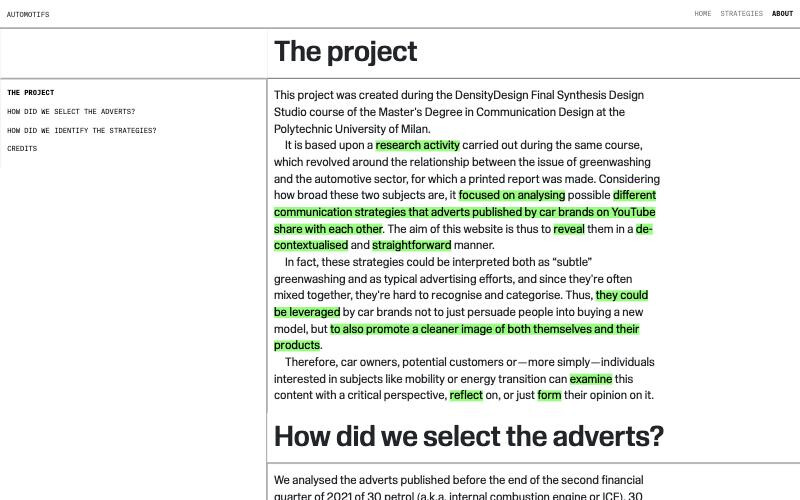
Inside an advert, these patterns pass unnoticed. Cut out and repeated across brands, they become obvious. Built for car owners, buyers and anyone interested in the energy transition: recognise the patterns, reflect, form an opinion.
Pick the clips that show the pattern from the 90 storyboards.
Plan a montage order that tells a story, not a list.
Cut and hand-pick the clips in Premiere Pro.
Apply the pattern’s edit in After Effects.
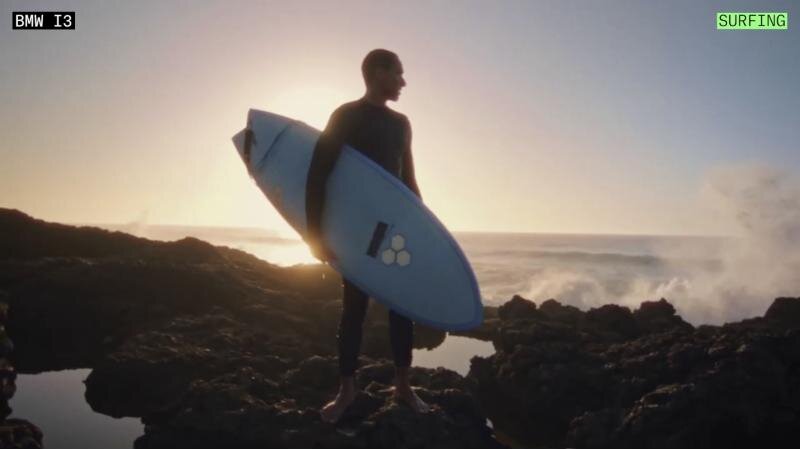
Green lifestyles · 17/90 adverts
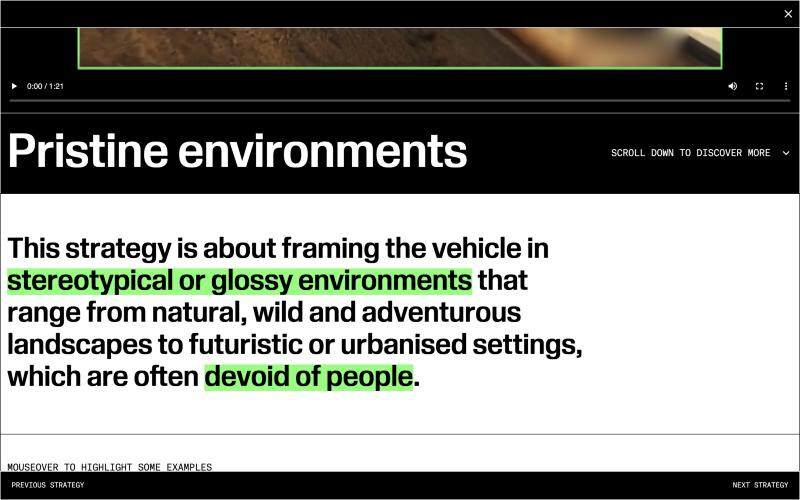
Frame the person, and the car becomes an accessory.
Characters ordered from people outdoors to influencers talking about sustainable living. A green box follows each one, moving attention from the car to who is selling it.

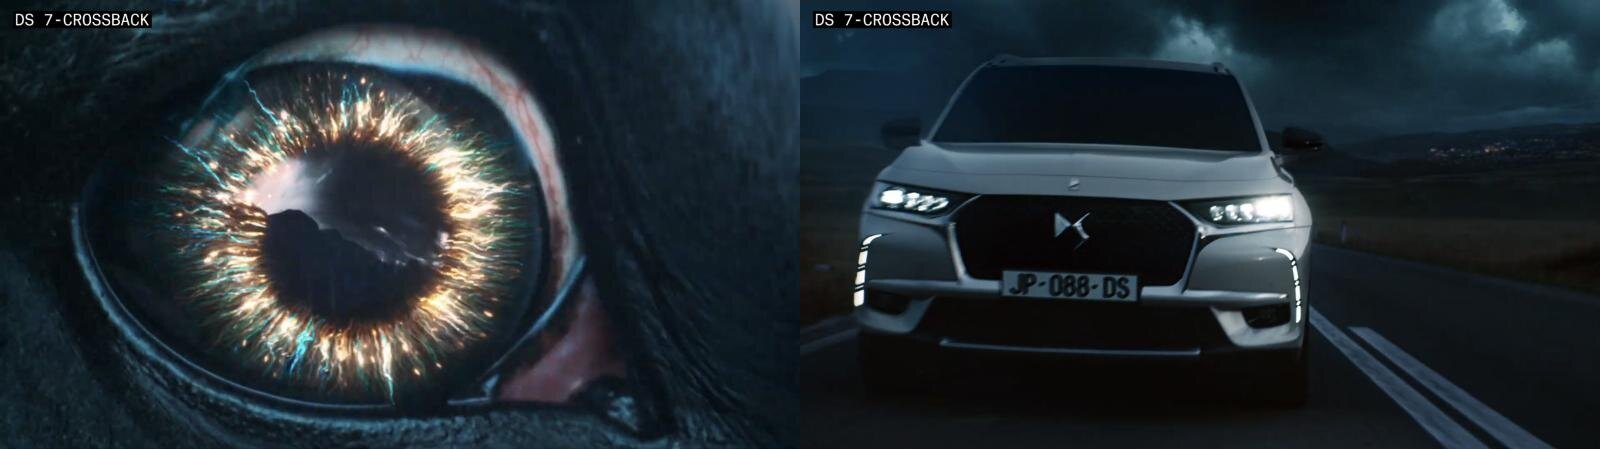
Green metaphors · 20/90 adverts
Split the metaphor, and the comparison shows its seams.
A metaphor works because its two halves are cut together. We split them into two synchronised tracks: nature on the left, the car on the right.
The other two videos
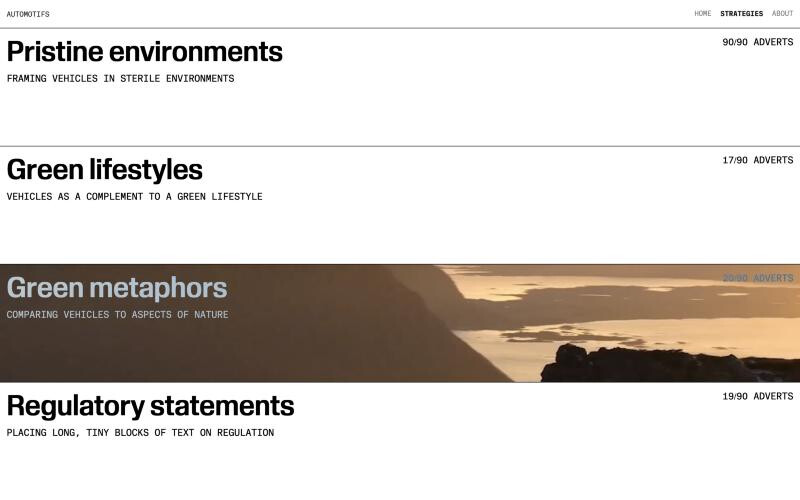
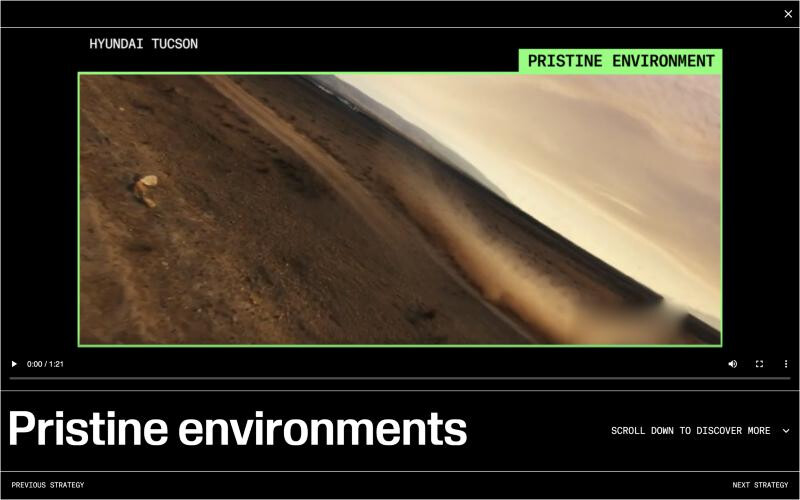
The experience
Choose, watch, read, verify.
What it adds up to
The pattern becomes visible when the adverts are examined together, not just one at a time.
That is why the evidence had to be counted, and why the videos put the patterns side by side: so viewers can judge them for themselves.
08Takeaways
Greenwashing isn’t always a lie. Often it’s a frame.
Slow it down, and it becomes countable
Pairing computer vision with human judgement works, as long as every step is documented.
Design makes evidence readable
From storyboard to video edit, design turned patterns into something seen in seconds.
The same skill, in products
Turn messy data into clear patterns, then design so people understand them at a glance.
Next time
Test with real viewers
Check whether drivers can name the patterns in an advert they haven’t seen.
Design for the phone first
Cut the supercuts for a vertical screen, where the adverts actually live.
Keep the dataset alive
An open archive of tagged frames, so the counts update as brands change.
- Course
- Final Synthesis Design Studio, MSc Communication Design, Politecnico di Milano, Sez. C3, 2022/2023
- Faculty
- Michele Mauri, Ángeles Briones, Gabriele Colombo, Simone Vantini, Salvatore Zingale
- Teaching assistants
- Elena Aversa, Andrea Benedetti, Tommaso Elli, Beatrice Gobbo, Arianna Bellantuono
- Sources
- Demandt, European car sales analysis 2021 (carsalesbase.com); Regulation (EC) No 715/2007; NEDC and WLTP; Collins English Dictionary
Huge thanks to our professors and teaching assistants for their guidance, and to the whole team for the collaboration.