Log-e · B2B SaaS · Logistics · 2023 — 2025

Pin2Pin.

A logistics platform that makes every delivery traceable, from the office to the doorstep.

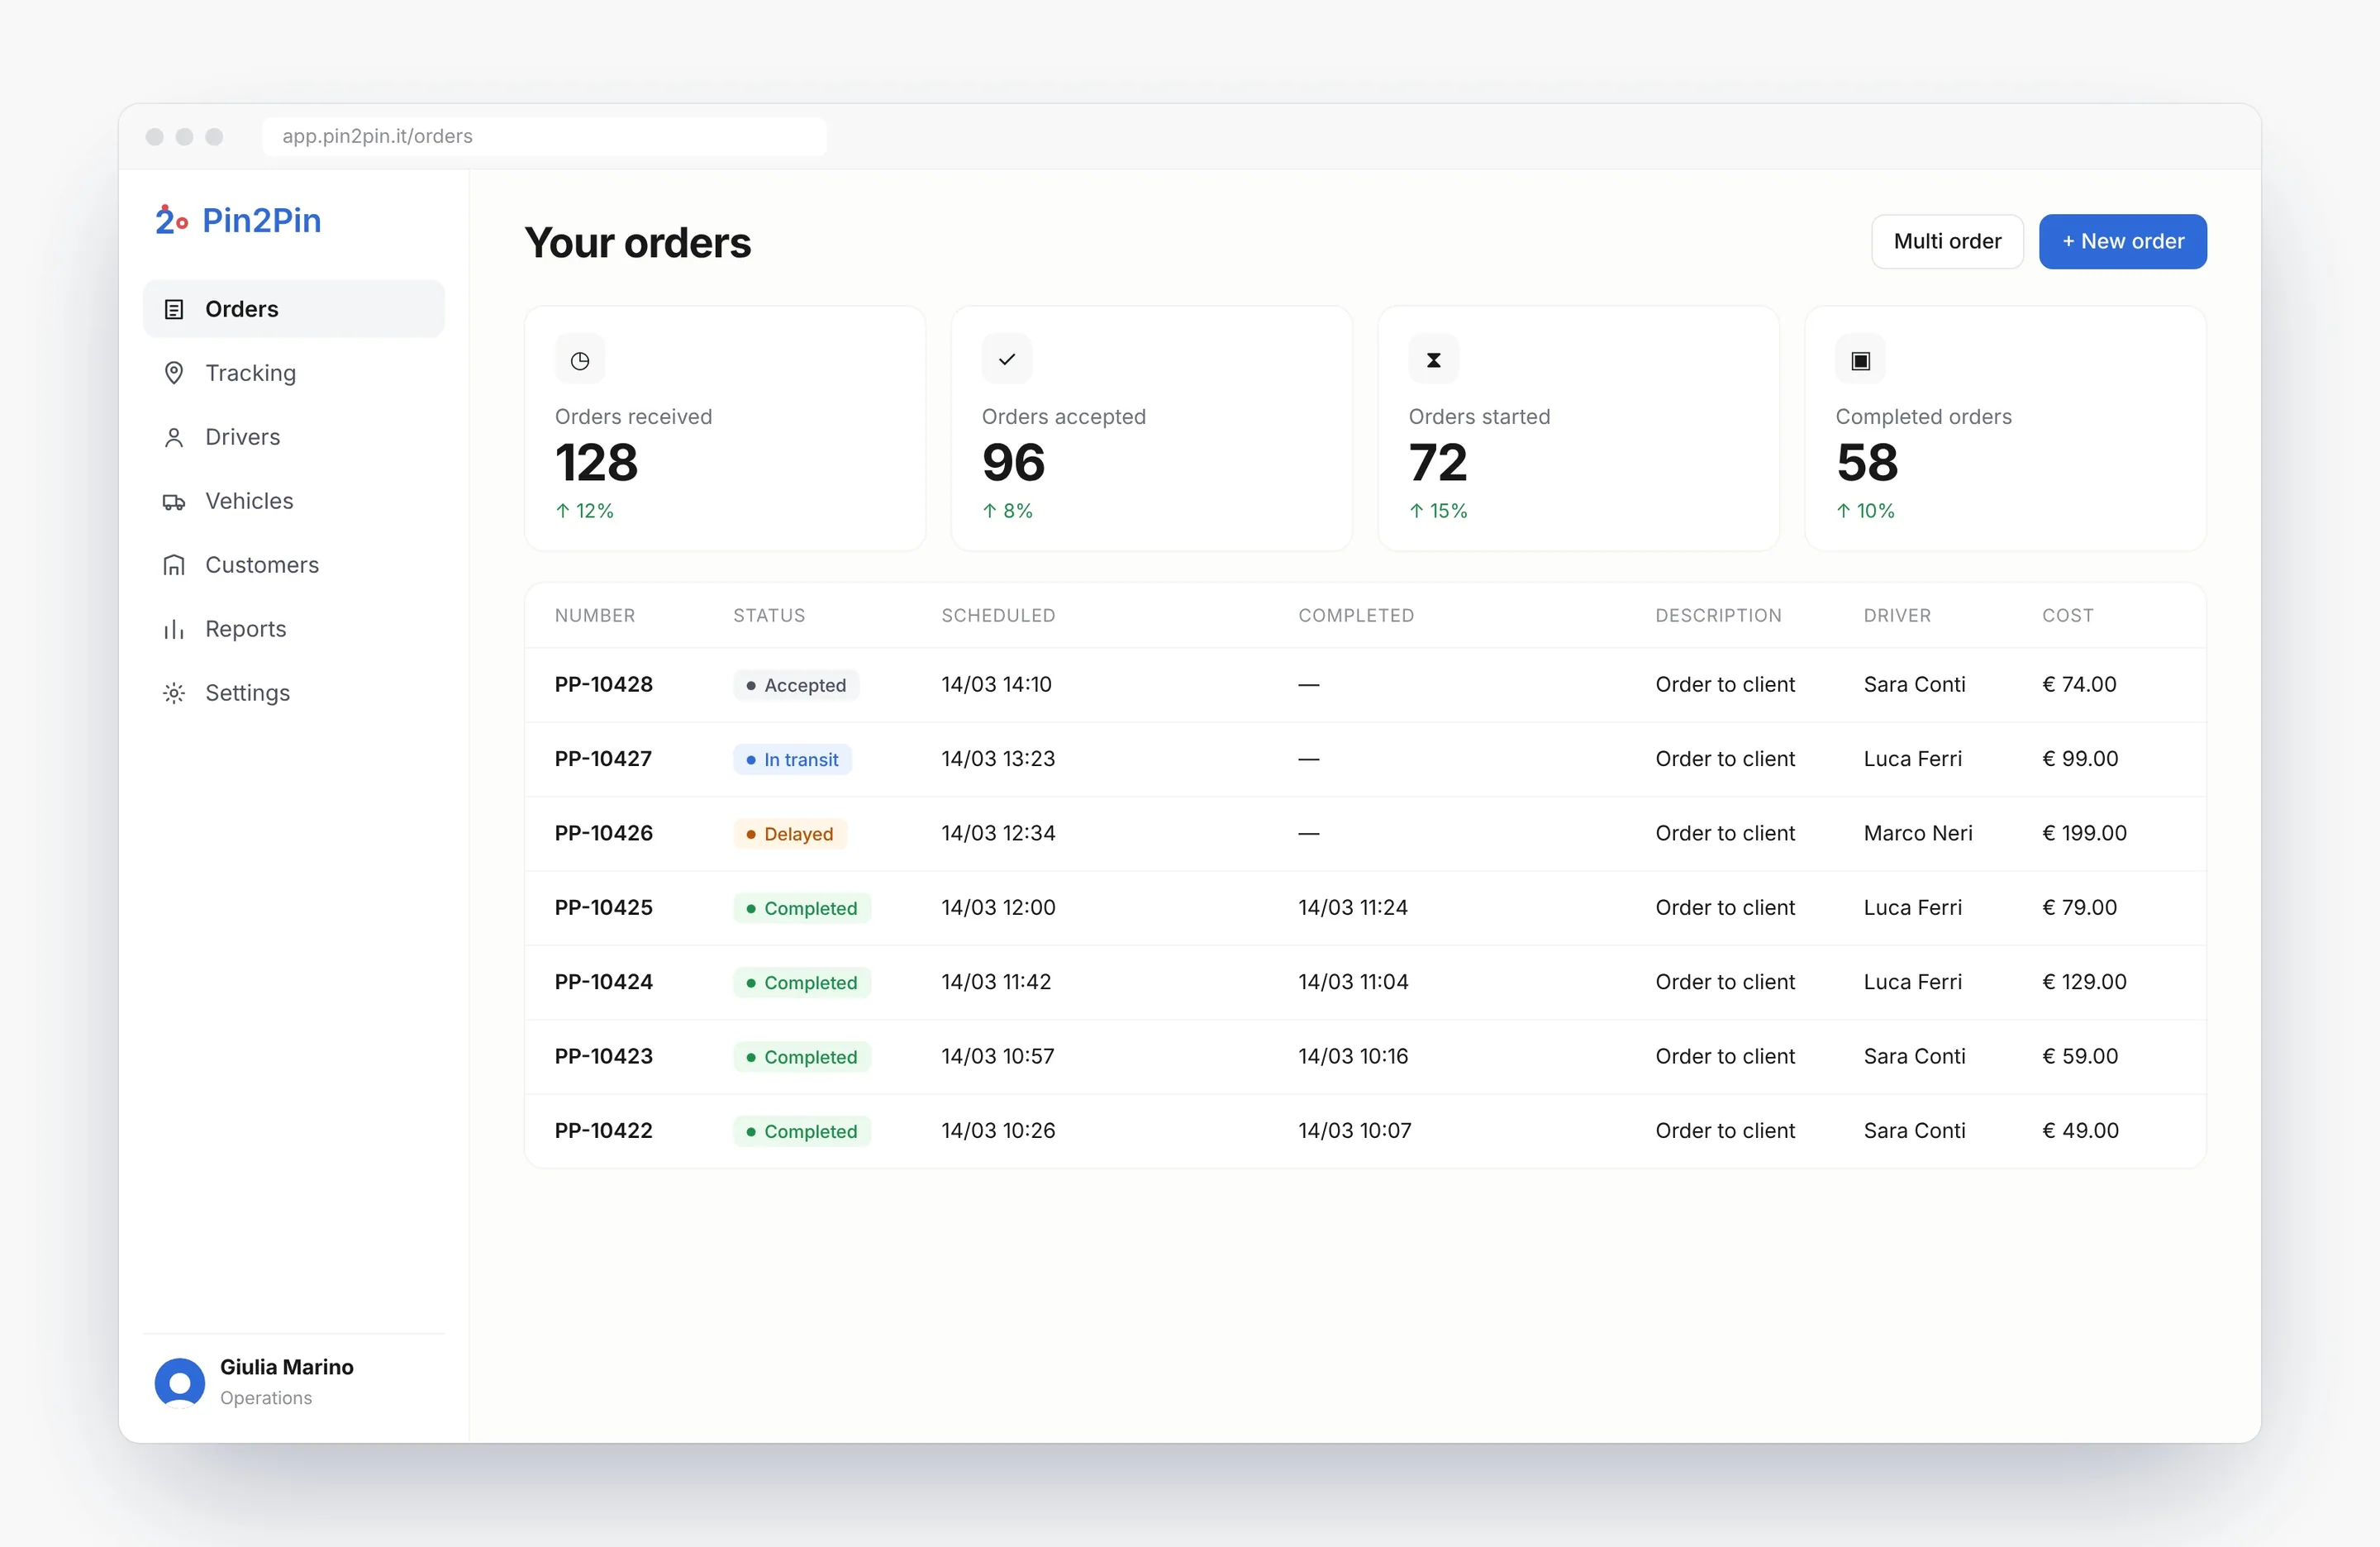
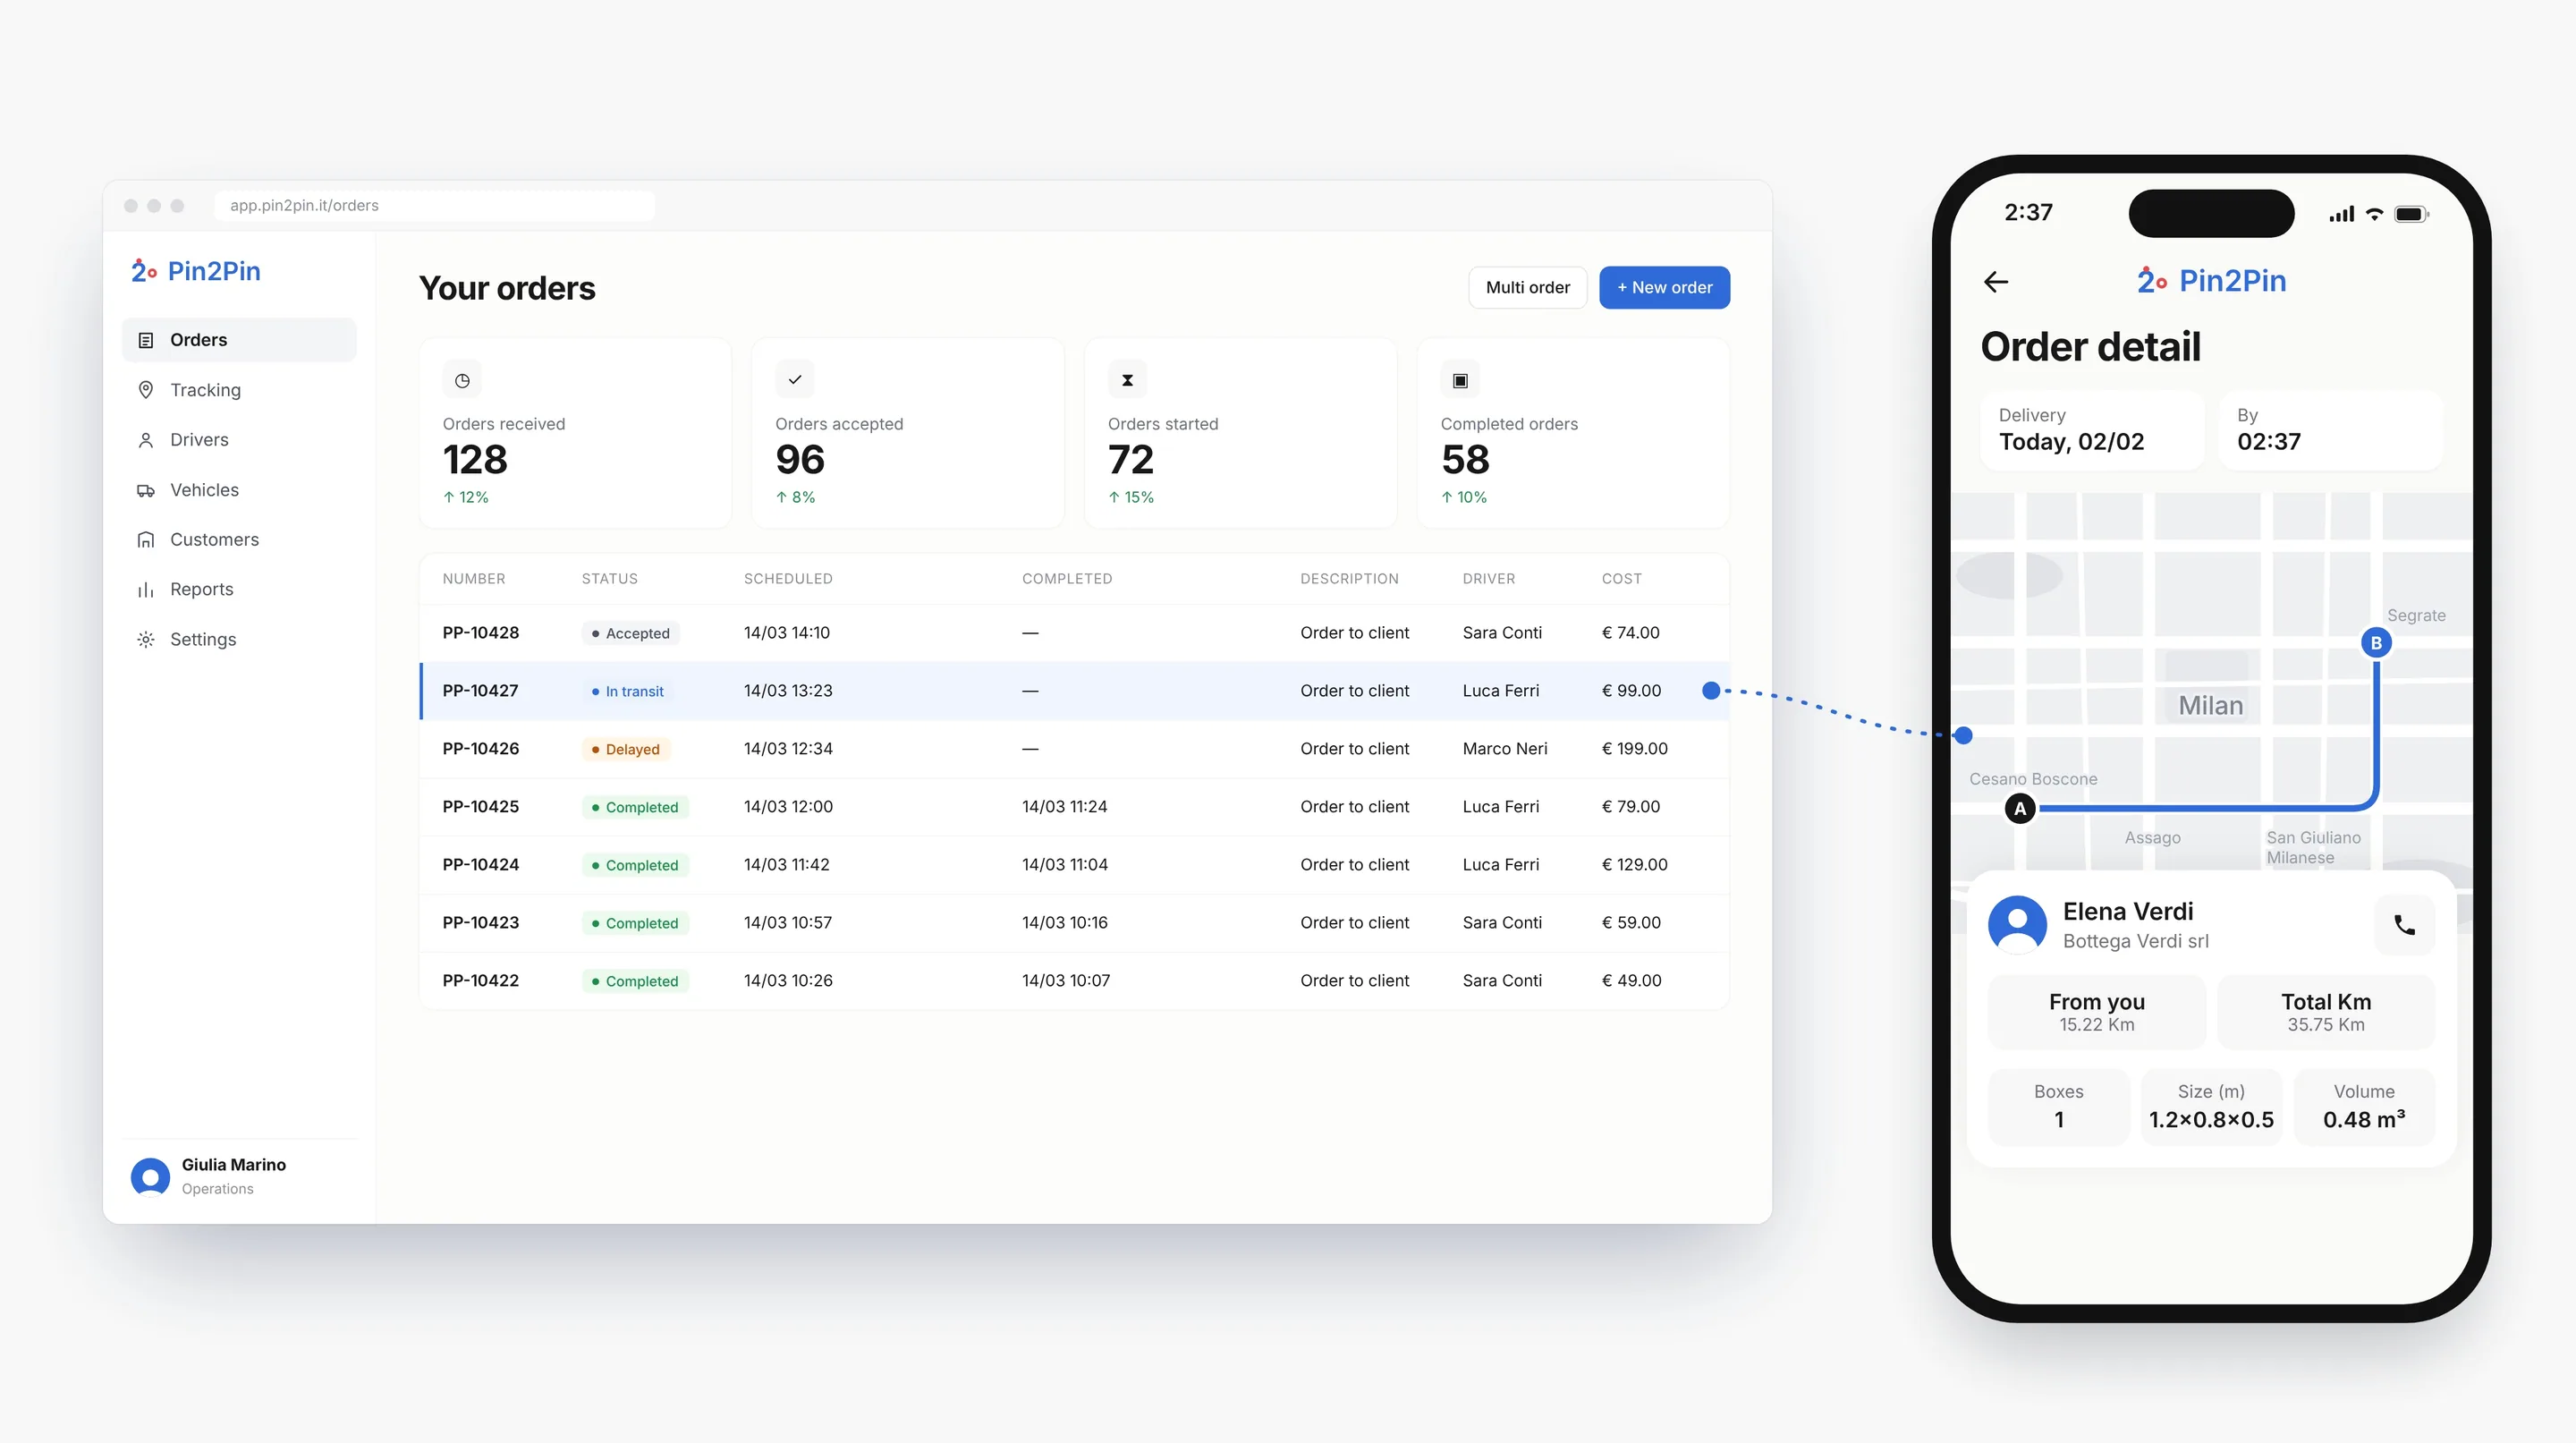
The Pin2Pin office dashboard with order PP-10427 highlighted, linked to the same order on the driver app

01Overview

The whole delivery, from office to road.

Pin2Pin is a product of Log-e, an enterprise platform for logistics, rental fleets and on-location services. It follows each order from the office that plans it to the driver who delivers it.

My role
UX/UI and brand designer, end to end
Timeline
2023 — 2025 at Log-e, alongside other projects
Platforms
Web dashboard for the office, mobile app for drivers
Users
Dispatchers, drivers and fleet admins
Status
Launched and refined release by release
Result
−40% status calls, as reported by Log-e

02The problem

Fleet software knew a lot, and showed it badly.

01 · Before the first order

Long setup

Long configuration and dedicated hardware before any value.

02 · While orders move

No live view of orders

Status lived in phone calls to the driver.

03 · When a box changes hands

Errors at the handover

Easy to make, and hard to prove.

03The solution

One order, visible to the office and provable on the road.

A dashboard that shows every order’s stage and place, and a driver app built around the handover: scan the boxes, add a photo, confirm. Both speak the same language, and both connect to the systems the company already uses.

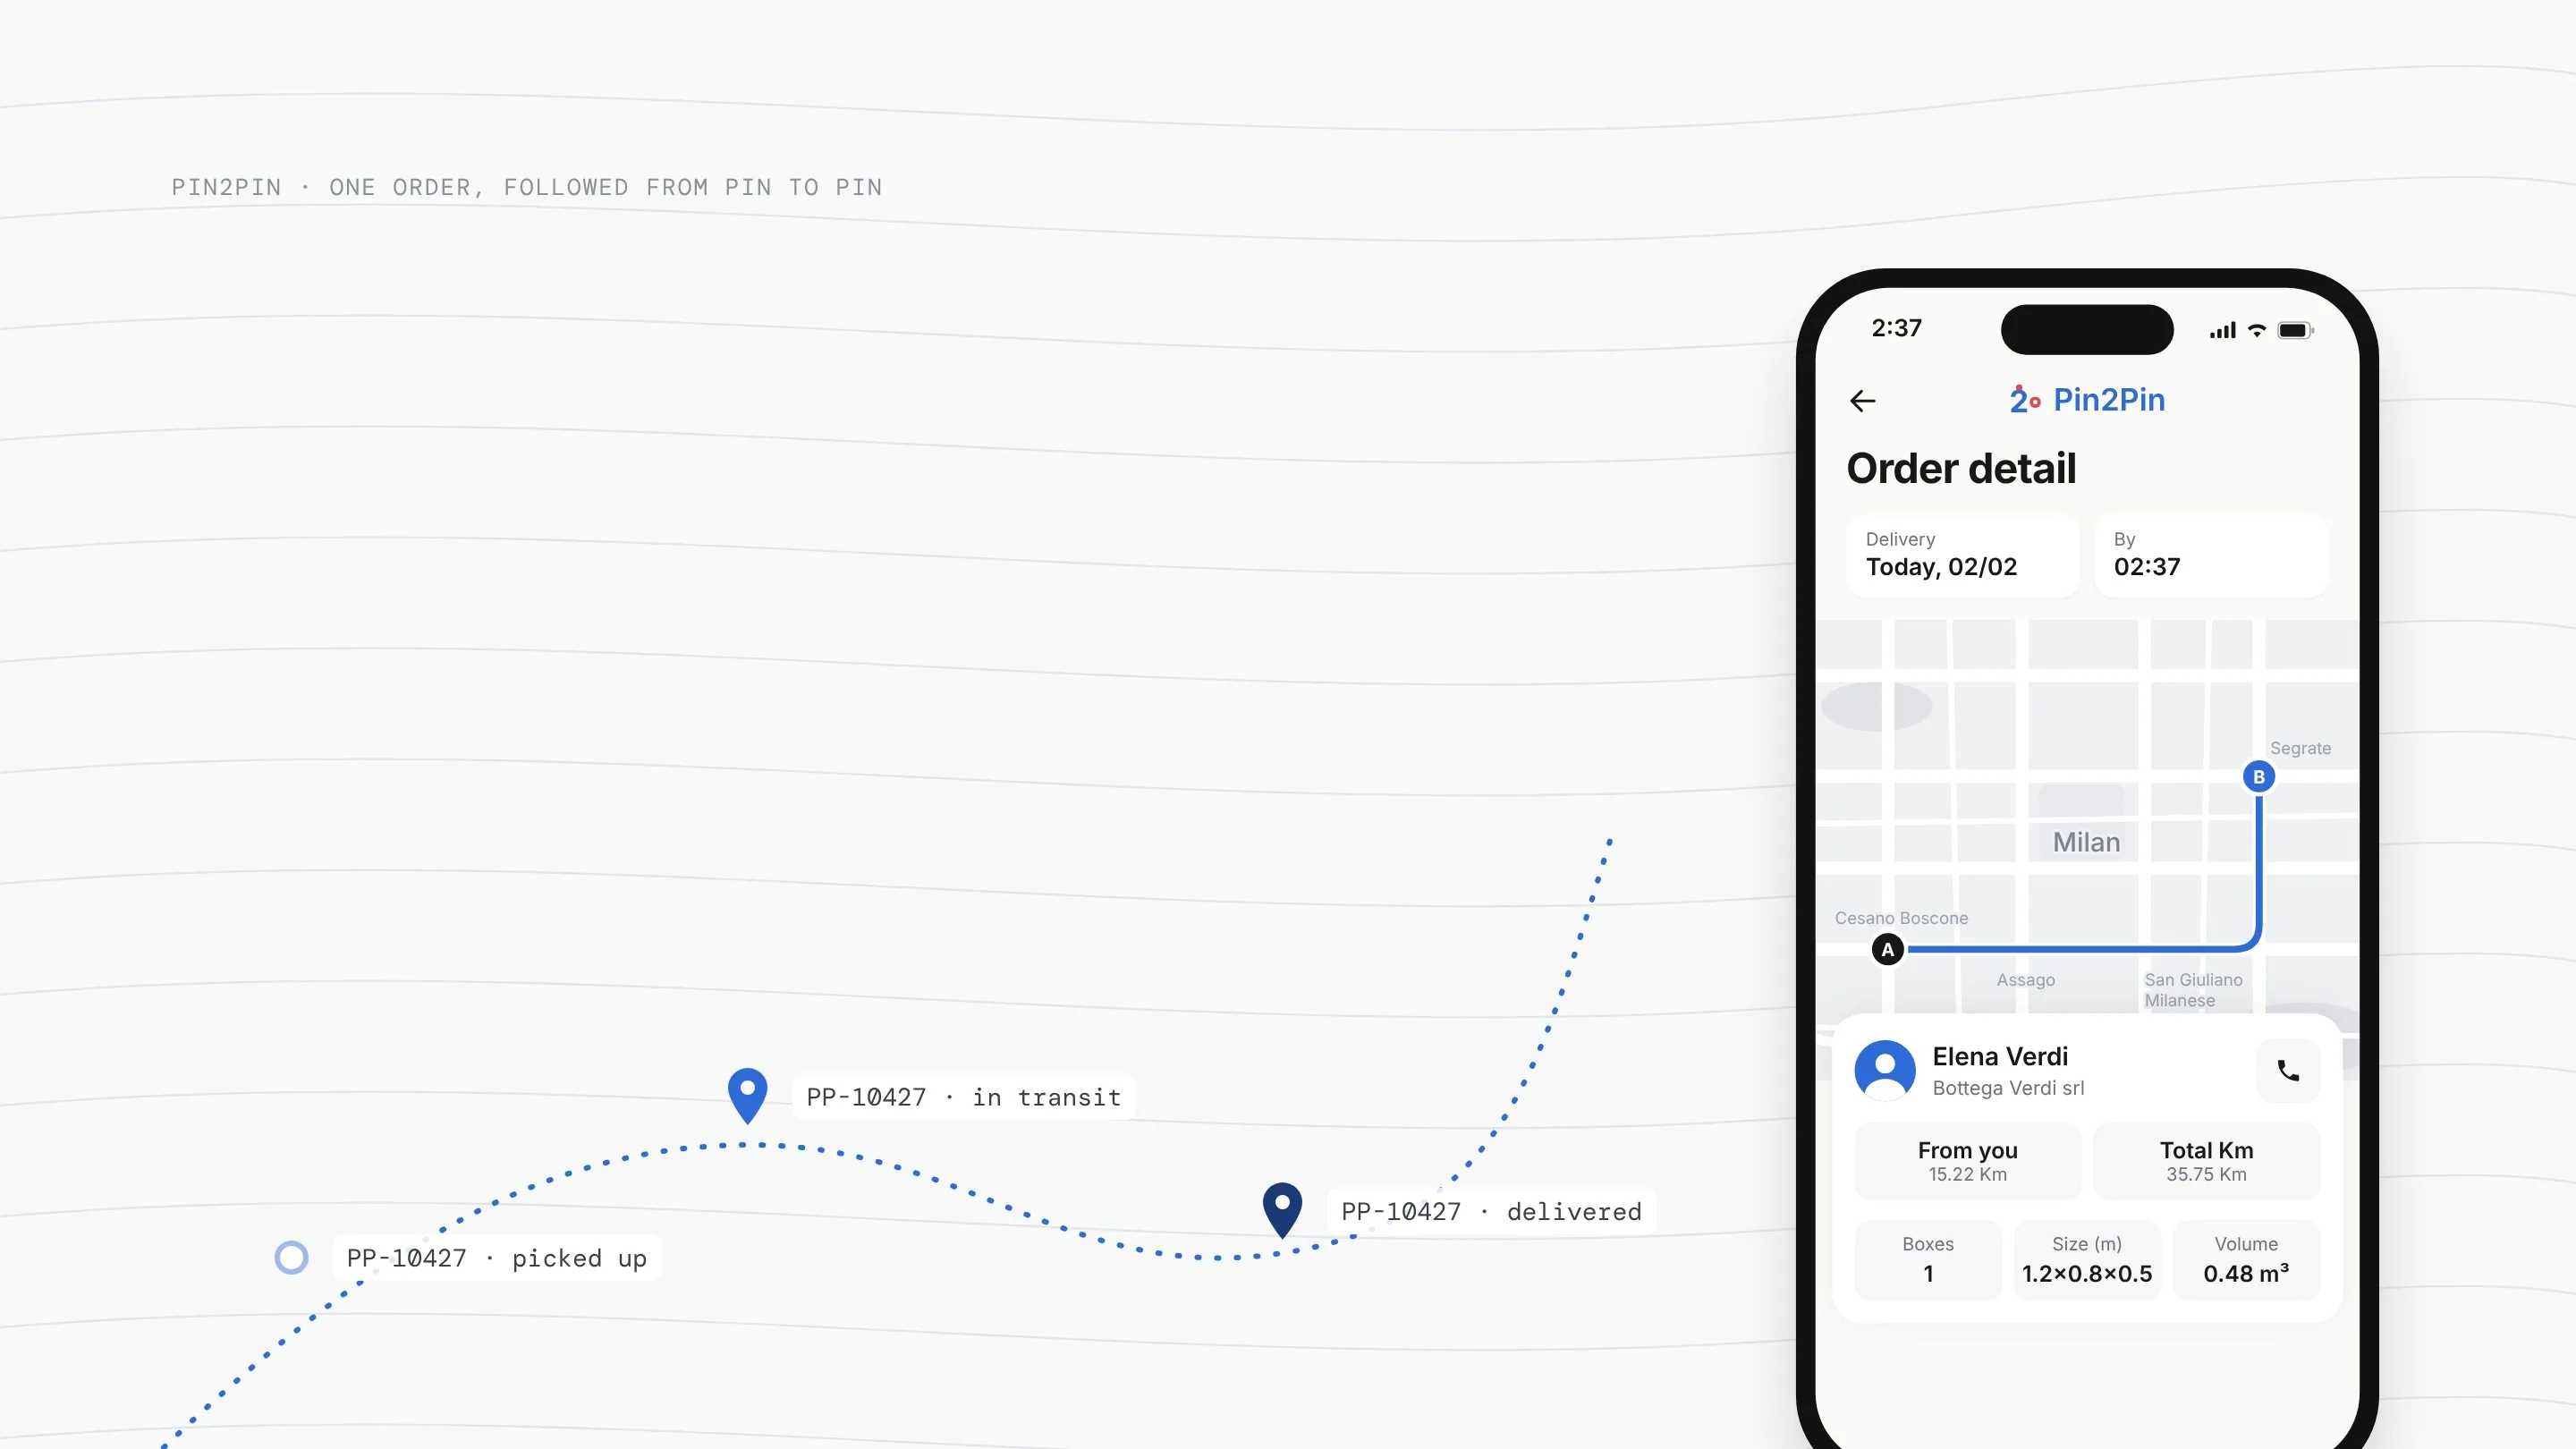
A route of order pins, picked up, in transit, delivered, and the order detail screen
One order, followed on the map and in the app: picked up, in transit, delivered.

At a glance

< 1 hto set up a company
~10 minto add a vehicle
20+rounds of usability testing
−40%status calls between drivers and the office, as reported by Log-e

04Research & users

Listening to the office and the road.

Both sides of every delivery had to be heard: interviews with 4–5 drivers and the office’s dispatchers and operations staff, a review of 5–6 fleet-management and delivery apps, and observation of real pickups, deliveries and office work.

Slow setupQuick setupFull order visibilityLittle visibilityPin2Pin (target)Enterprise TMS suitesTelematics + hardwareSimple delivery appsSpreadsheets + phone callsGeneric fleet trackersQualitative, from the review of 5–6 apps

Where Pin2Pin aimed to fit · analytical reconstruction

The tools we reviewed were either complete but slow to set up, or quick but blind once an order left the office. None combined live order visibility, recorded handovers and quick setup.

A qualitative positioning, not a measurement: each group is placed by how long setup takes and how much of an order’s journey the office can see.

In their words

“I don’t need a complicated app. I just need to know what to do next.”
Driver interview · Navigation & clarity
“When something changes, I need the office to know immediately.”
Driver interview · Real-time communication

Three roles, three very different screens.

Office

Dispatcher

Plans, creates and assigns orders all day, with many moving at once.

NeedsStatus at a glance, orders in a few clicks.

Road

Driver

Between stops, phone in one hand, often in a hurry and outside.

NeedsOne action per screen, readable at arm’s length.

Company

Fleet admin

Sets up the company, its vehicles and the link to the systems it already uses.

NeedsTo get the fleet working without a long configuration first.

From research to requirements

How might we make every order visible and every handover provable, without adding work for the driver?

  1. Visible

    Every order’s stage and place, live, for the office.

    BecauseStatus lived in phone calls to the driver.

    BecameLive tracking and order-stage counters.

  2. Provable

    A scan and a photo at every handover.

    BecauseErrors happened when boxes changed hands, and nothing recorded it.

    BecameScan, photo and box count inside the pickup.

  3. Fast to start

    Little time between signing up and the first order.

    BecauseLong configuration and hardware came before any value.

    BecameA few short, guided setup steps.

Synthesis written for this case study, from the research findings.

05Structure

One product, three users, two connected interfaces.

The product is mapped around the life of a single order; the dashboard and the app share the same vocabulary, so a dispatcher and a driver can talk about one order without translating.

Office · dispatcher, fleet admin

Web dashboard

Orders, live tracking, drivers, vehicles, customers, reports and settings.

Road · driver

Driver app

Availability, today’s orders, pickup, scanning and photo proof, delivery and history.

Company · existing systems

ERP and TMS link

Orders in; status and documents out, so nothing is typed twice.

OFFICEDRIVERSYSTEMS Create ordersingle or multiple Assigndriver and vehicle Live trackingstatus · location Reportsorders · costs Go to pickuproute · instructions Scan + photoproof at every handover Deliverconfirm · history Company ERP and TMSorders in, status and documents out

The life of one order. The highlighted step makes errors easier to trace: every handover can be scanned and photographed.

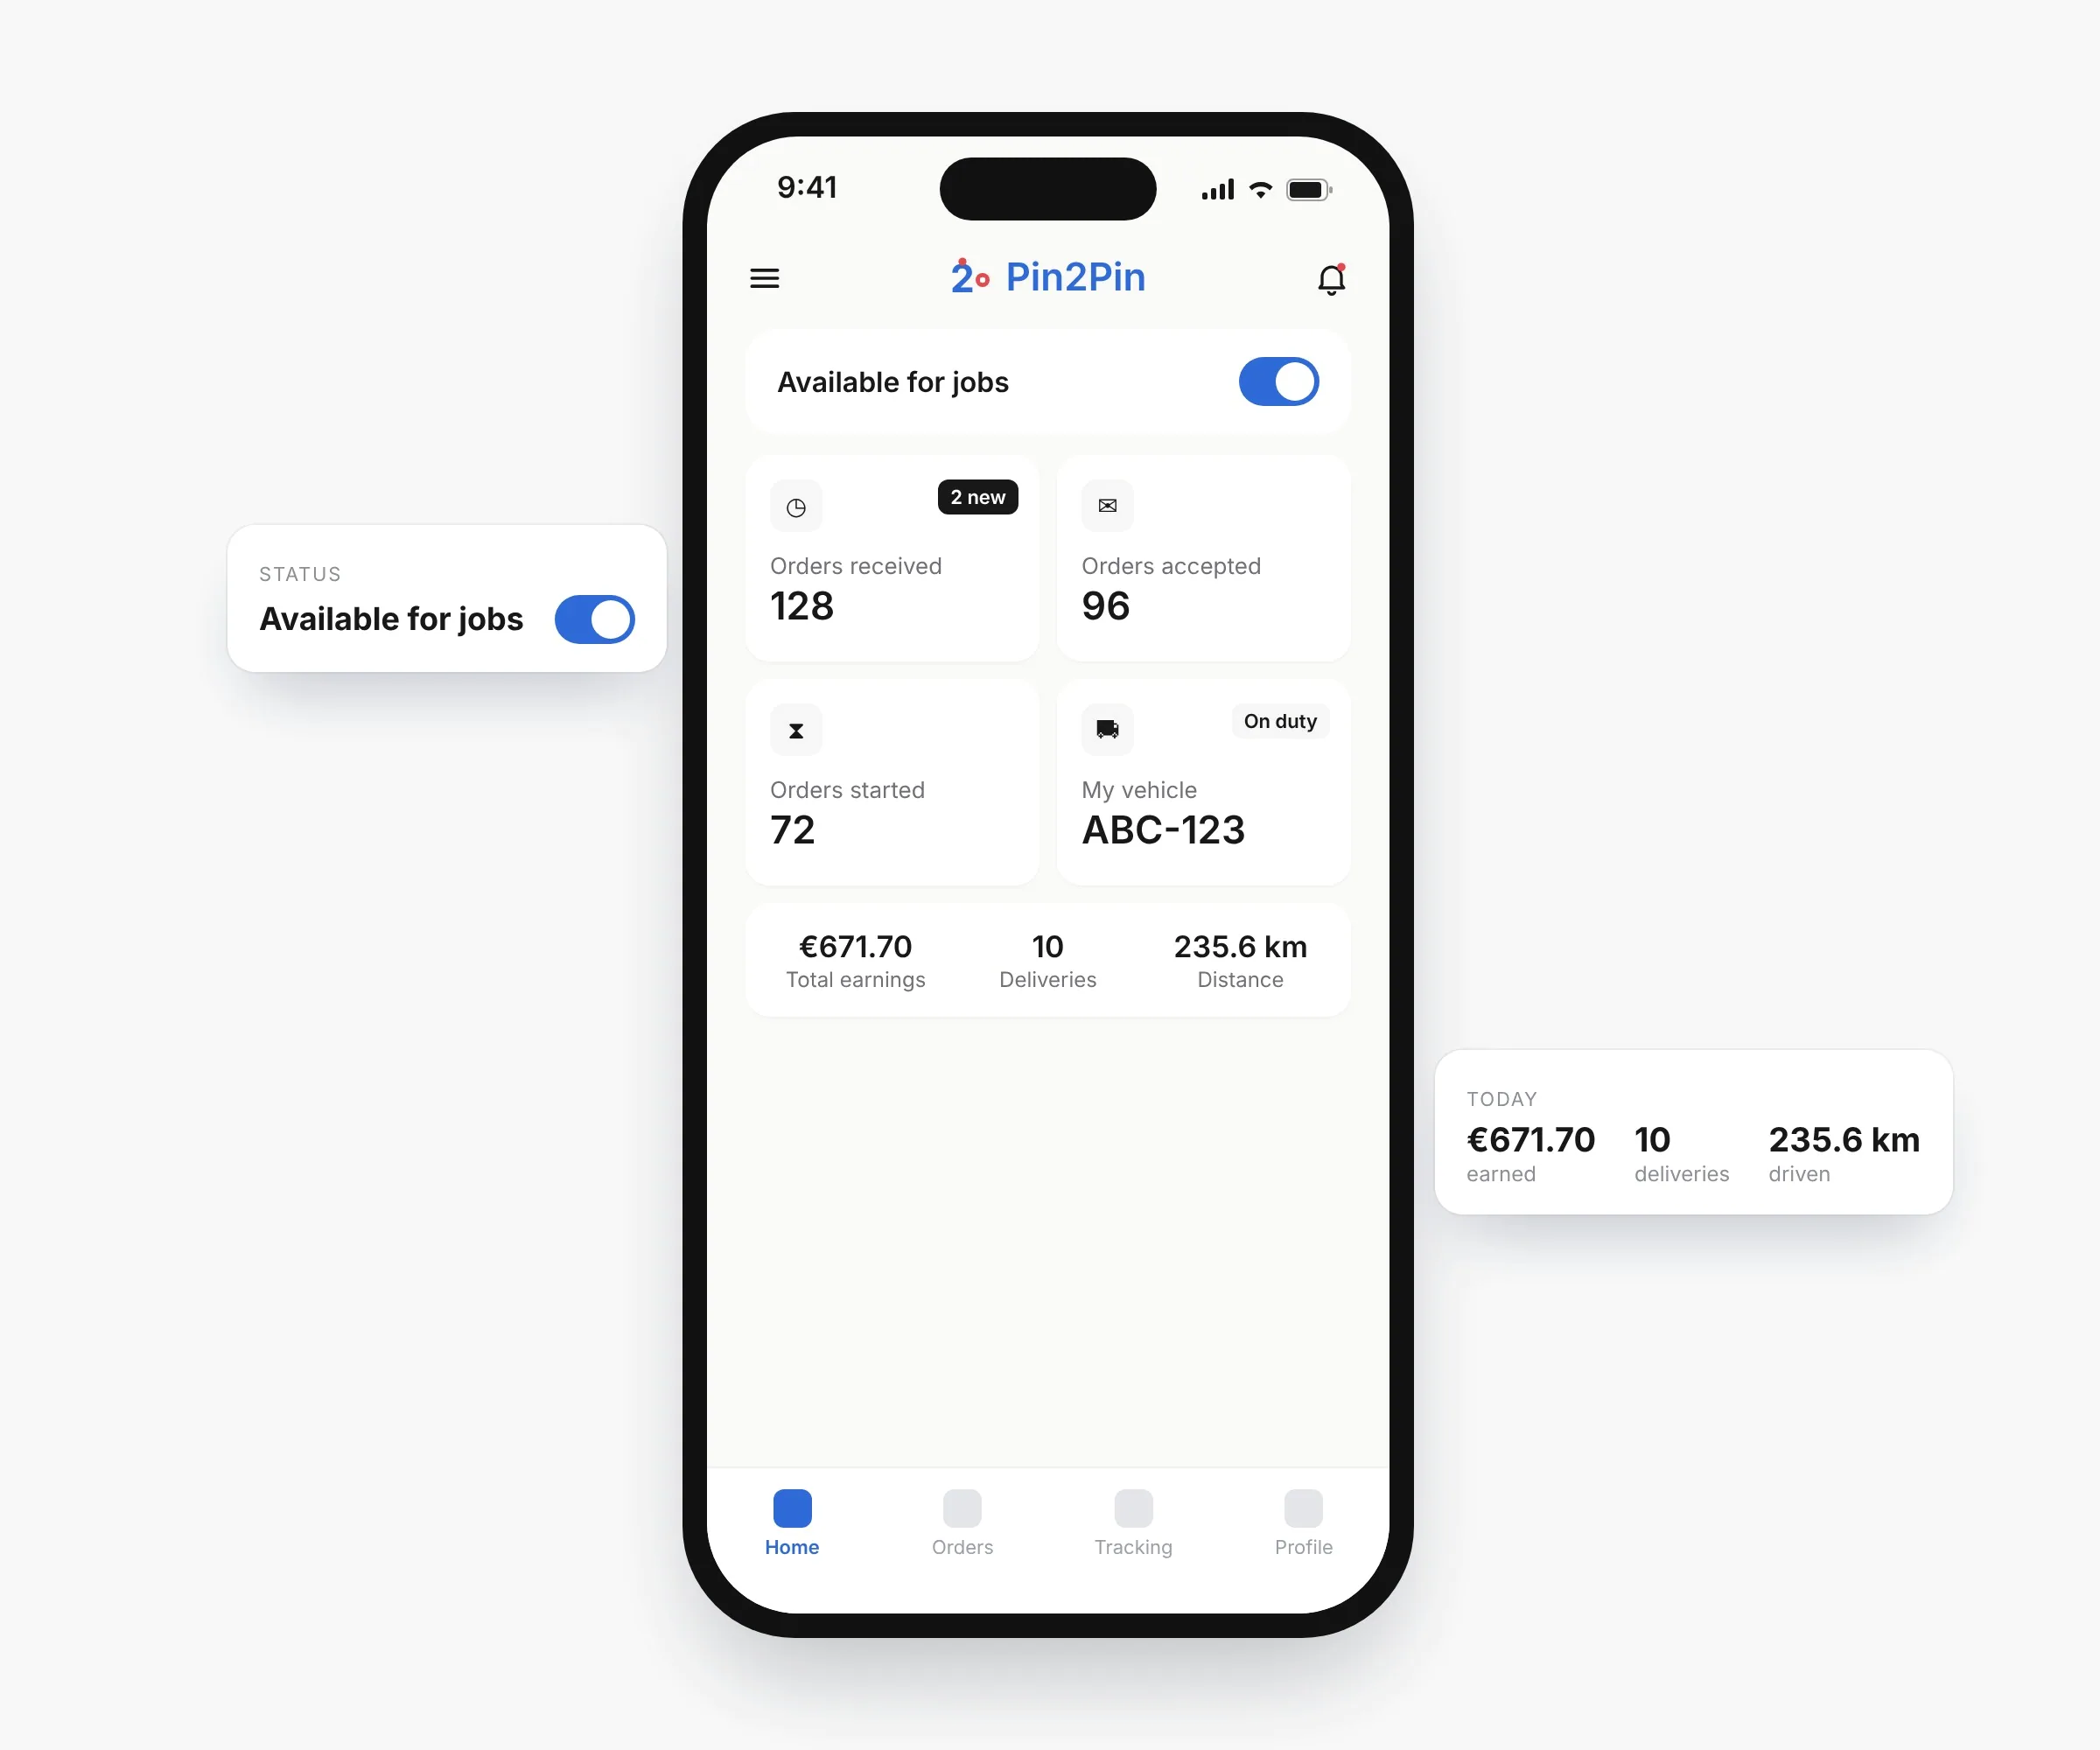
WEB DASHBOARD · OFFICEOrdersTrackingDriversVehiclesCustomersReportsSettingsSame name, same meaningDRIVER APP · ROADHomeOrdersTrackingProfile

Information architecture. Orders and Tracking share the same name on both sides.

Web dashboard · office
Orders · Tracking · Drivers · Vehicles · Customers · Reports · Settings
Mobile app · driver
Home · Orders · Tracking · Profile
Shared
Blue sections have the same name on both sides

06Testing

Twenty rounds of testing, release after release.

Every release was tested with drivers and office teams. When people struggled to find a feature, understand an order or finish setup, the issue was documented and guided the next iteration. After launch, feedback from drivers and the office kept shipping as refinements.

What testing changed

Navigation · seen in testing

Users couldn’t find things

People looked for the same feature in different places, in the dashboard and in the app.

Change

Restructured navigation into clear sections, with the same names on both sides.

Information hierarchy · seen in testing

The dashboard was too crowded

Too much competed for attention, so the important things were hard to see.

Change

Led with four order-stage counters and moved detail into the list below.

Task flow · seen in testing

Setup took too long

Configuring the company and its vehicles was slow and hard to finish without help.

Change

Simplified setup to under an hour for a company and about ten minutes per vehicle.

The loop behind every change

RequirementsInformationarchitectureWireframesPrototypeUsabilitytestDocumentedchangesHandoverDesign QANEXT RELEASE · 20+ ROUNDS

The loop behind every release. Findings from each test were documented before handover.

Requirements → Information architecture → Wireframes → Prototype → Usability test → Documented changes → Handover → Design QA

07Key decisions

Three moments where the product had to work.

Each one starts from something we saw in research or testing, and lands on one screen.

On the road

A driver shouldn’t have to call to know what’s next.

Drivers told us they don’t need a complicated app, they need to know what to do next. When instructions hide in the details, the fallback is calling the customer from the van, or opening three screens to prepare one trip.
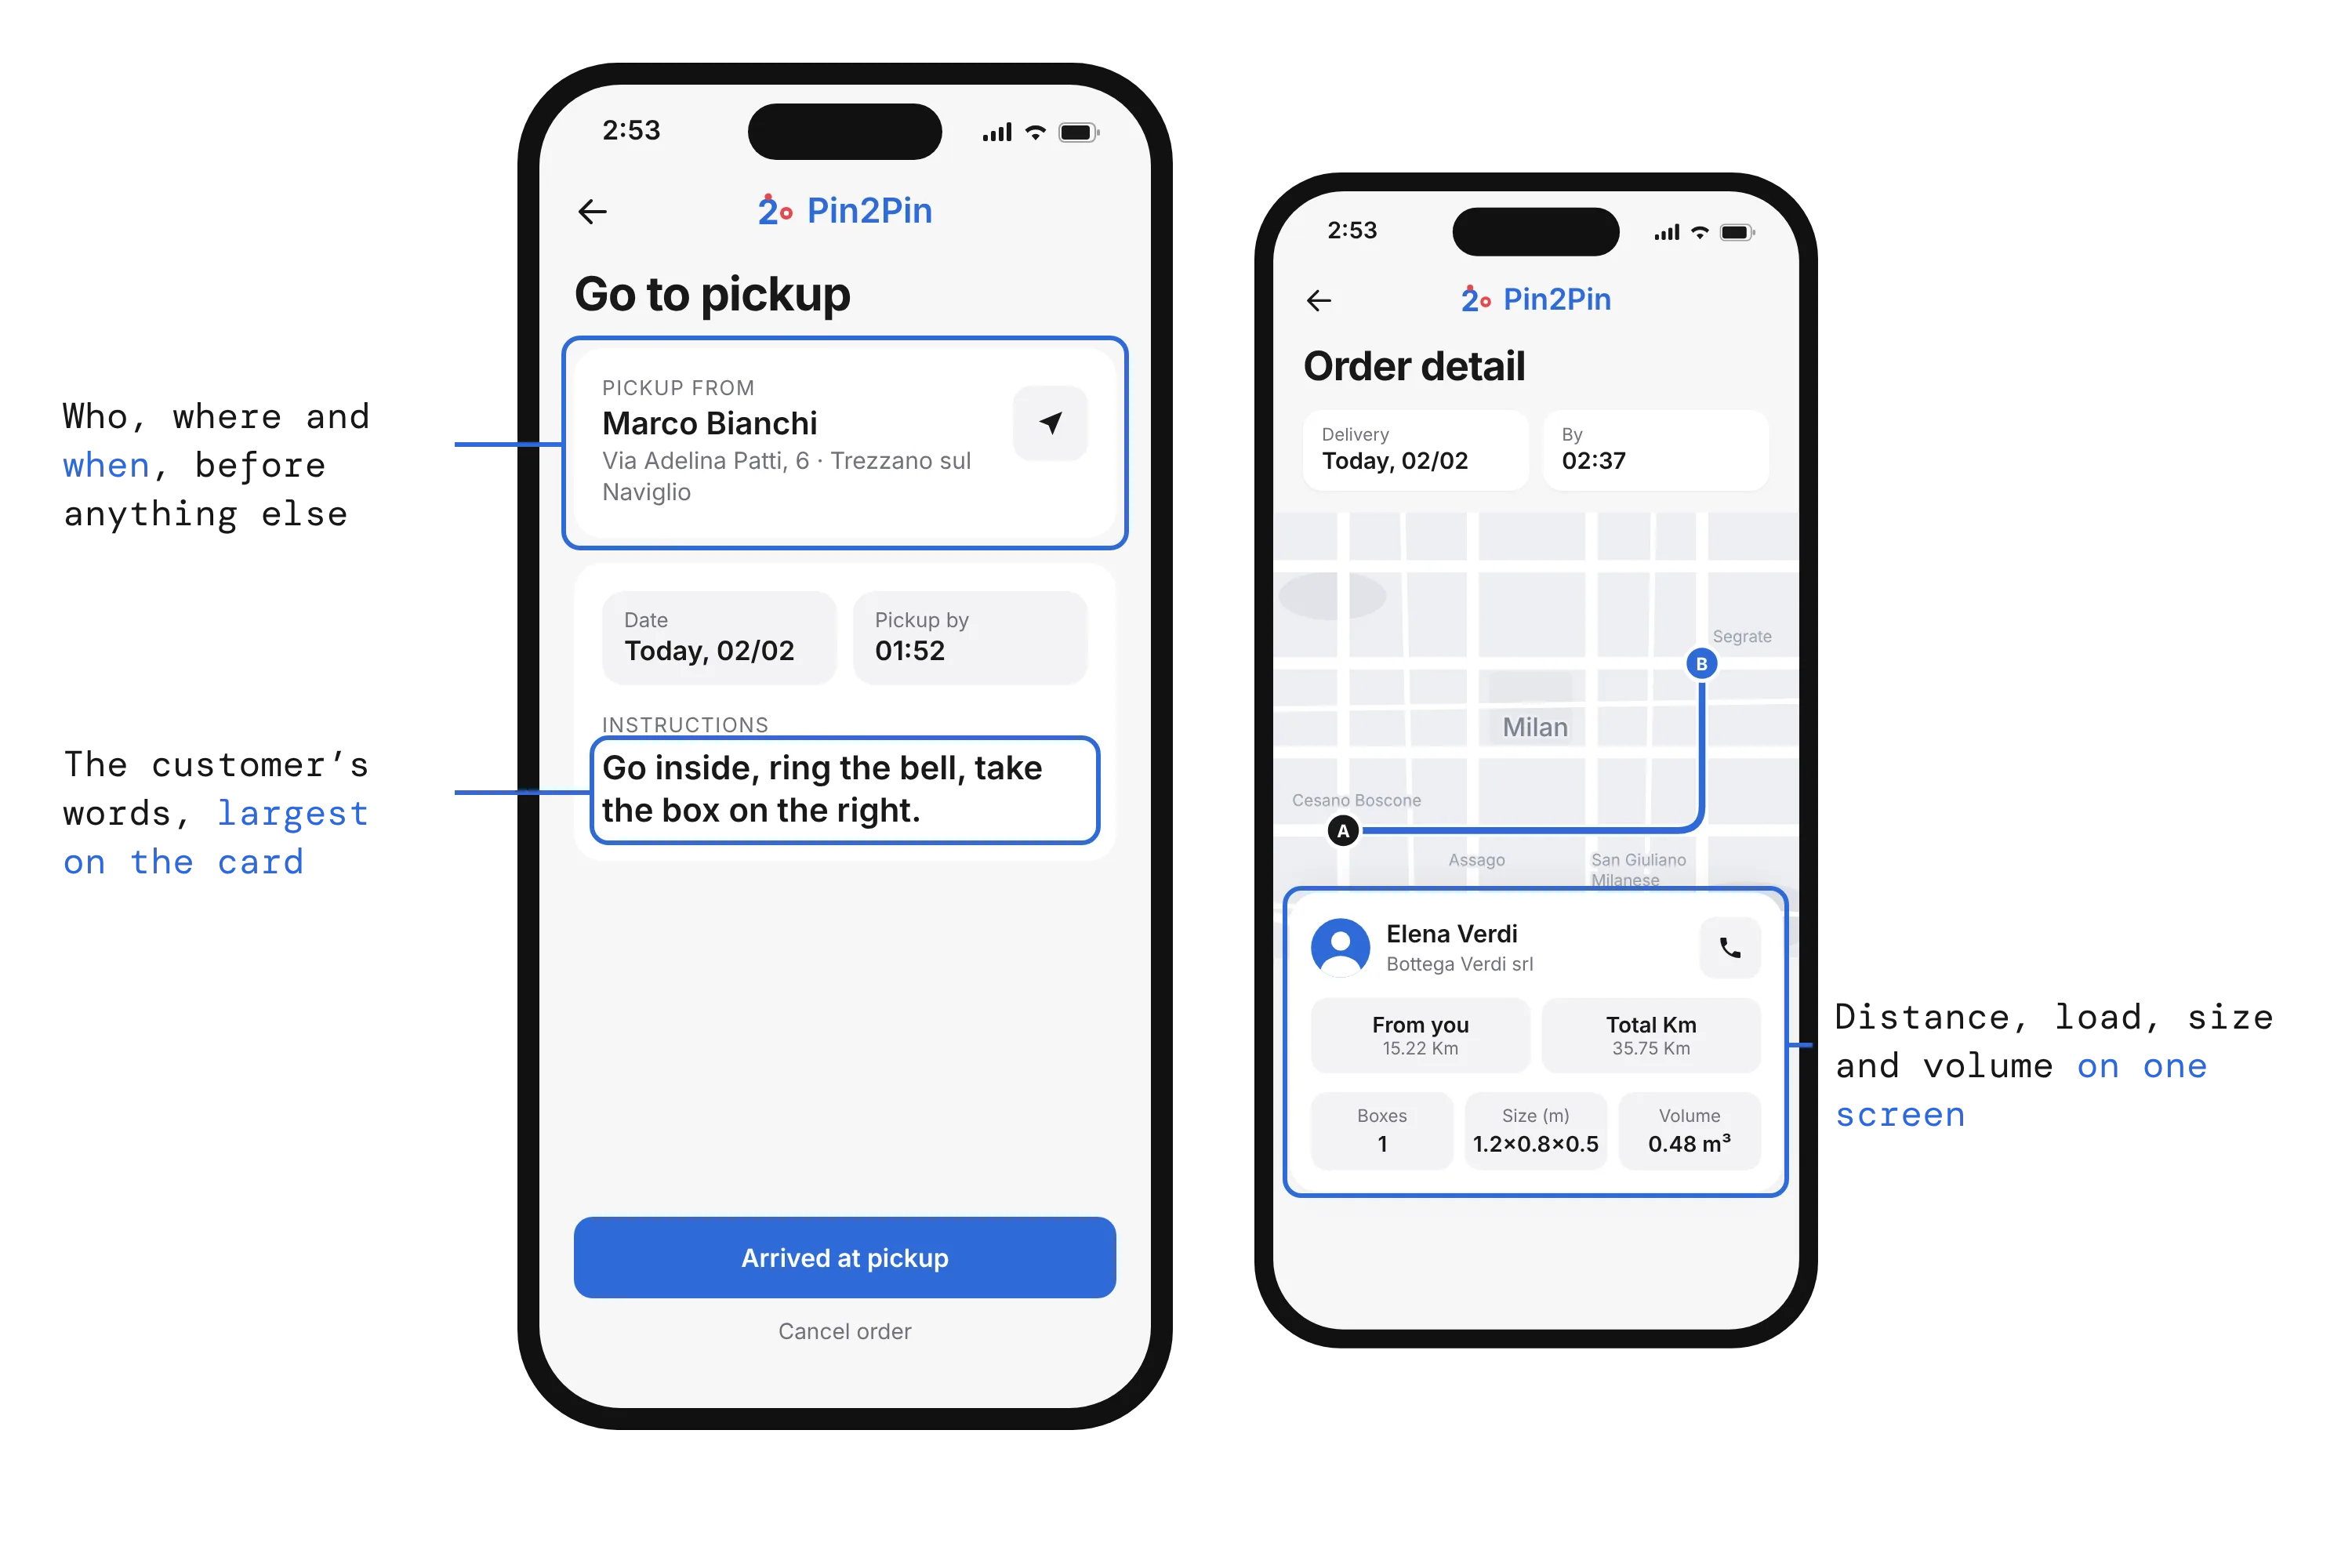
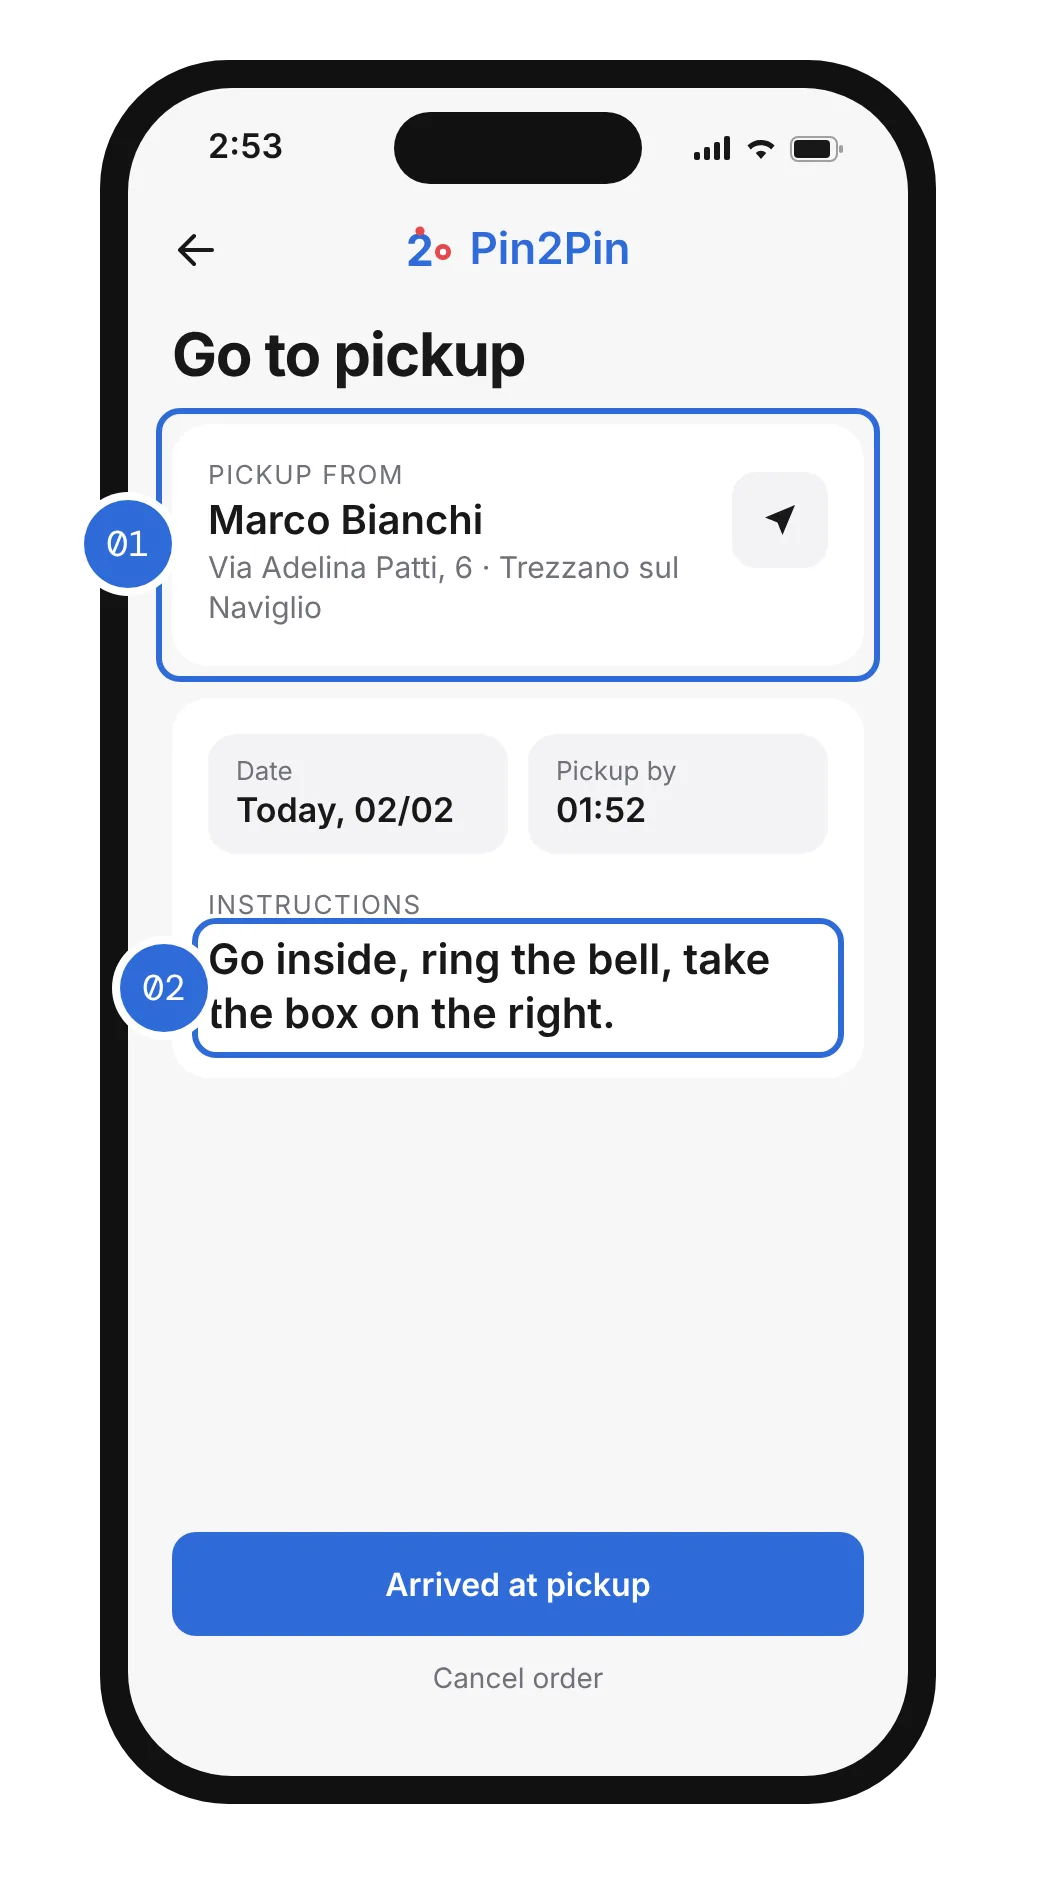
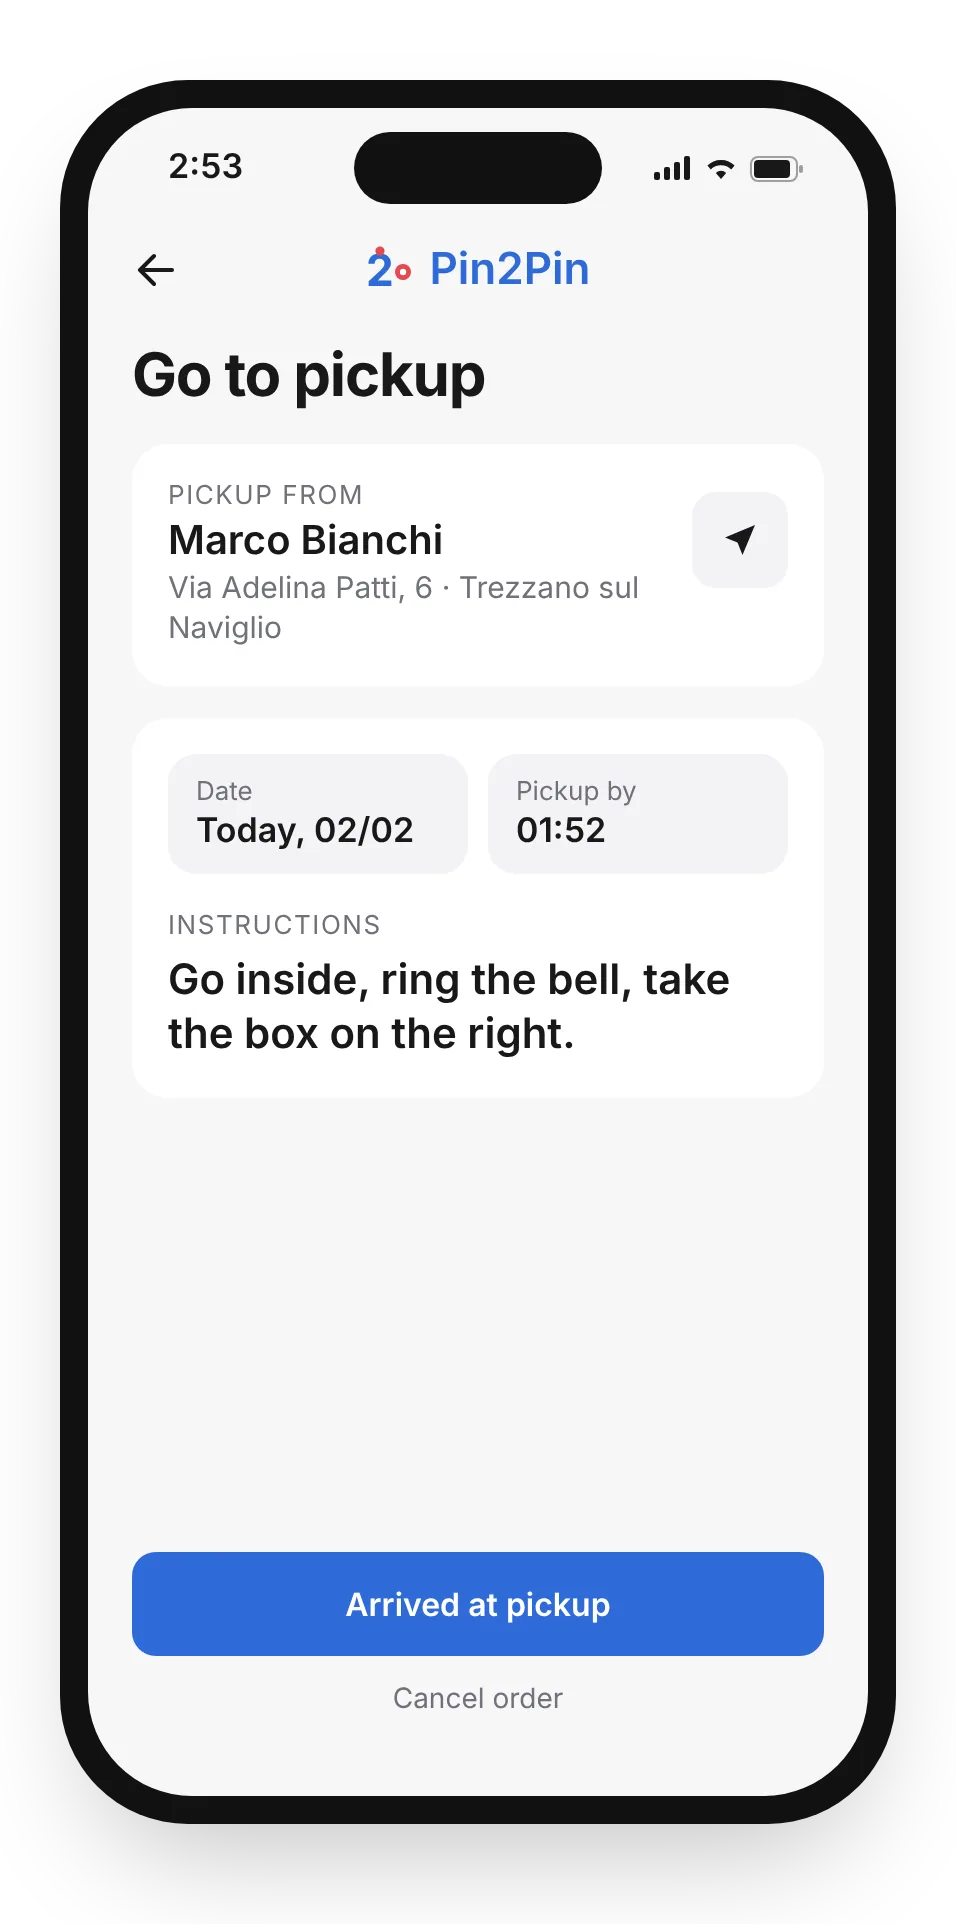
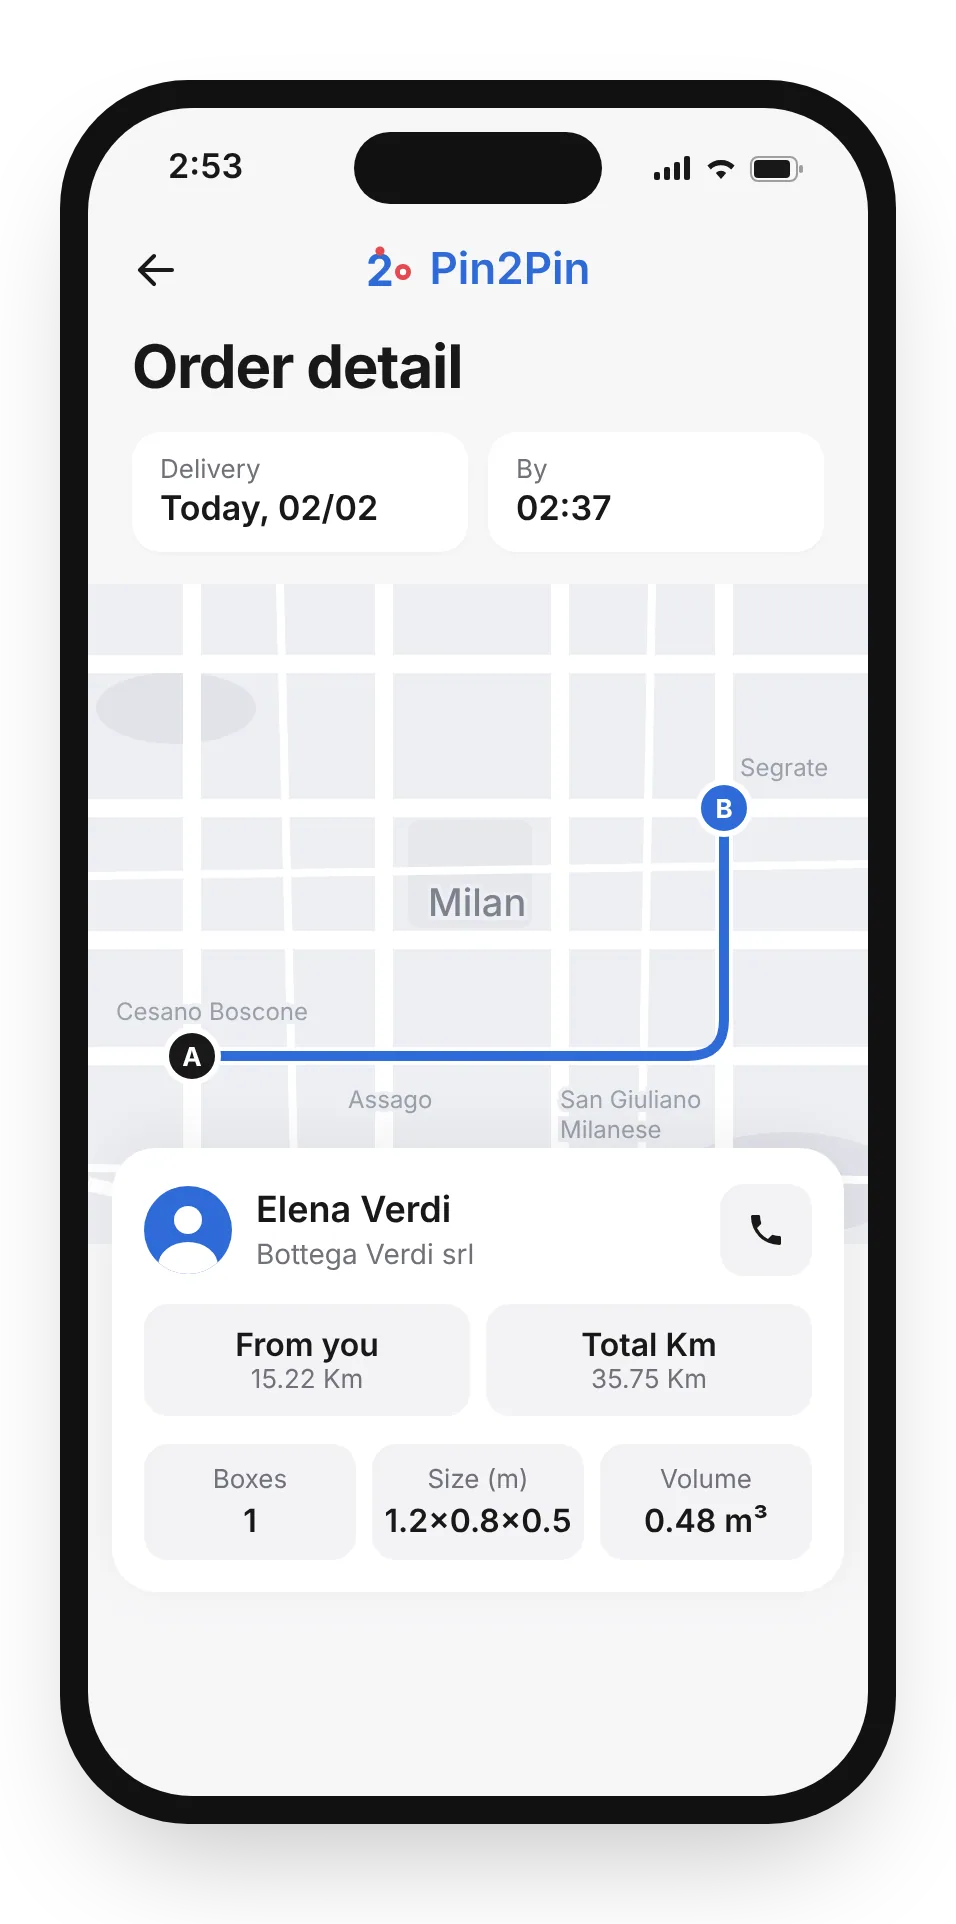
Go to pickup and Order detail screens, with the pickup card, the customer’s instructions and the trip details called out
Go to pickup screen, with 01 the pickup card and 02 the customer’s instructions marked
  1. Who, where and when, before anything else
  2. The customer’s words, largest on the card
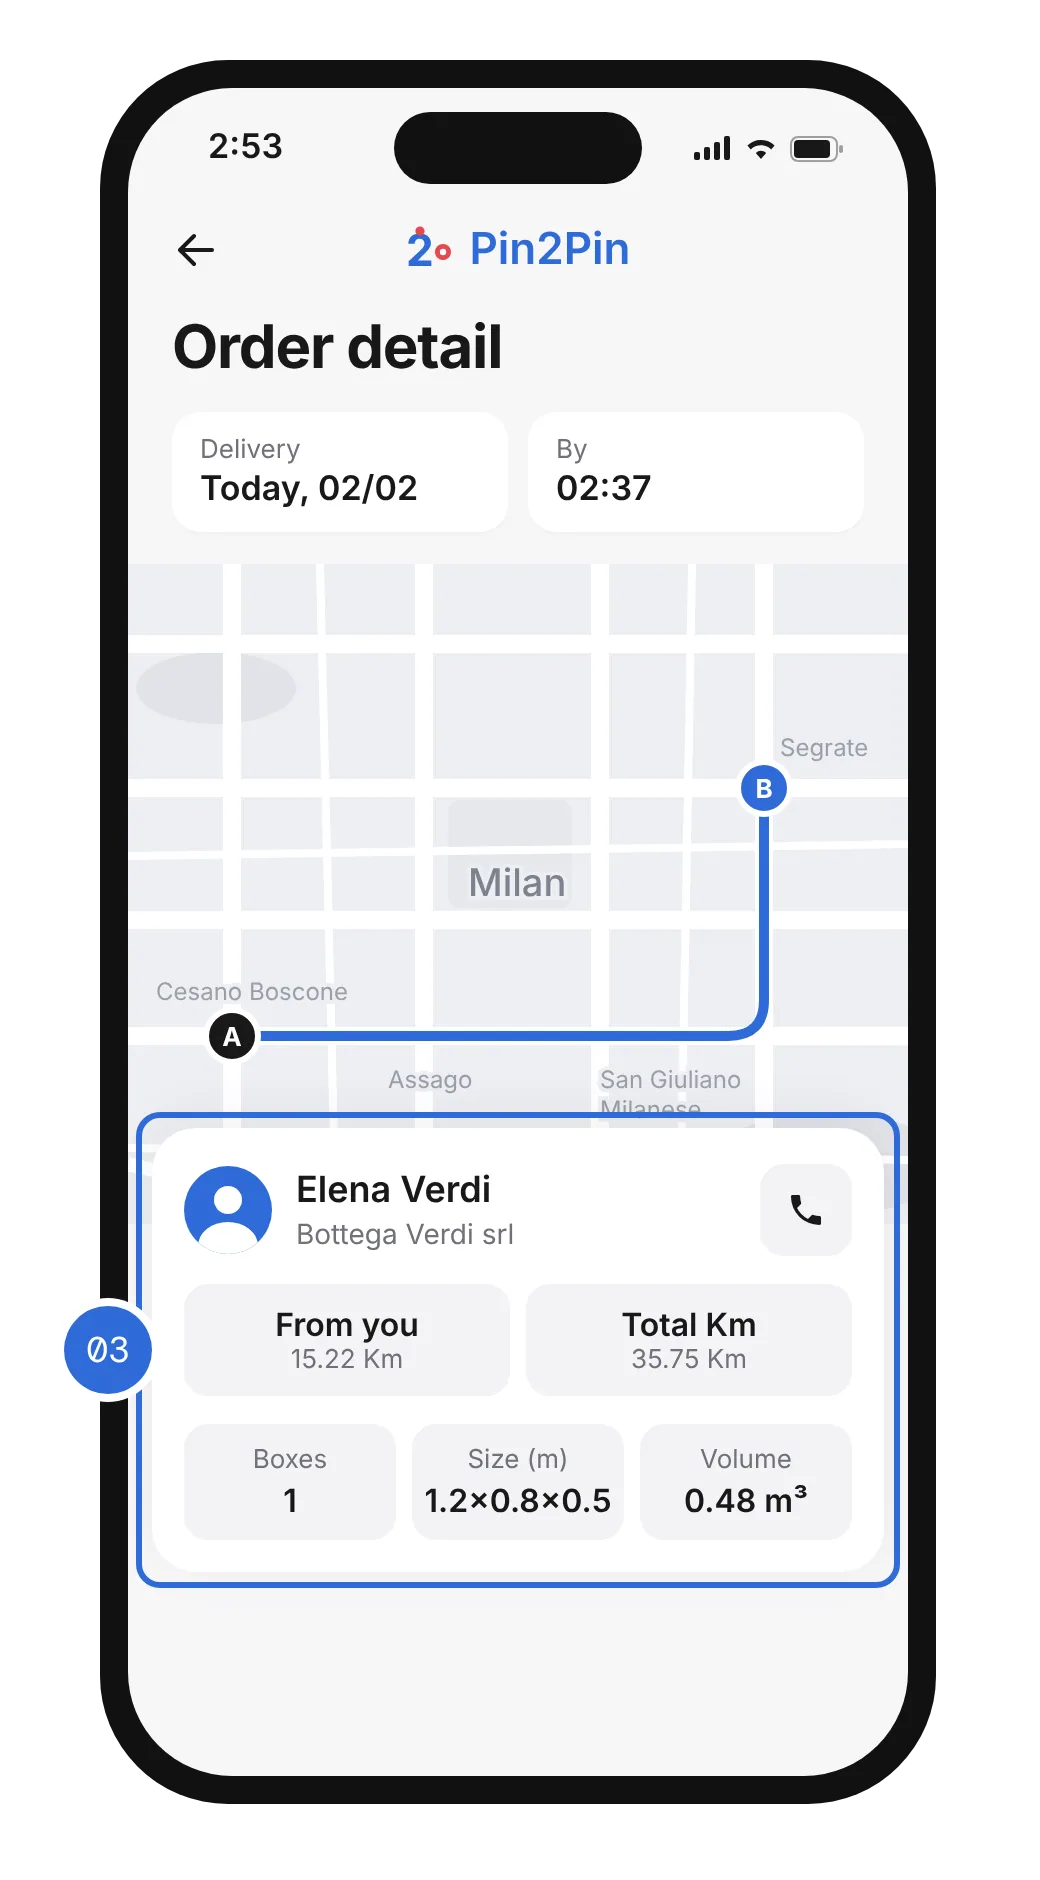
Order detail screen, with 03 the trip details marked
  1. Distance, load, size and volume on one screen

So the customer’s pickup notes are the largest text on the card, and map, distances, boxes, size and volume sit together on one screen, with the customer one tap away. One dense screen asks for a little more reading, but it replaces three screens to prepare one trip: one look before leaving, and the driver knows what to do on arrival.

At the handover

A handover shouldn’t depend on memory.

Pickup and delivery were the riskiest moments: boxes changed hands and nothing recorded it. A tick box would have been quick, but it proves nothing when something goes missing.
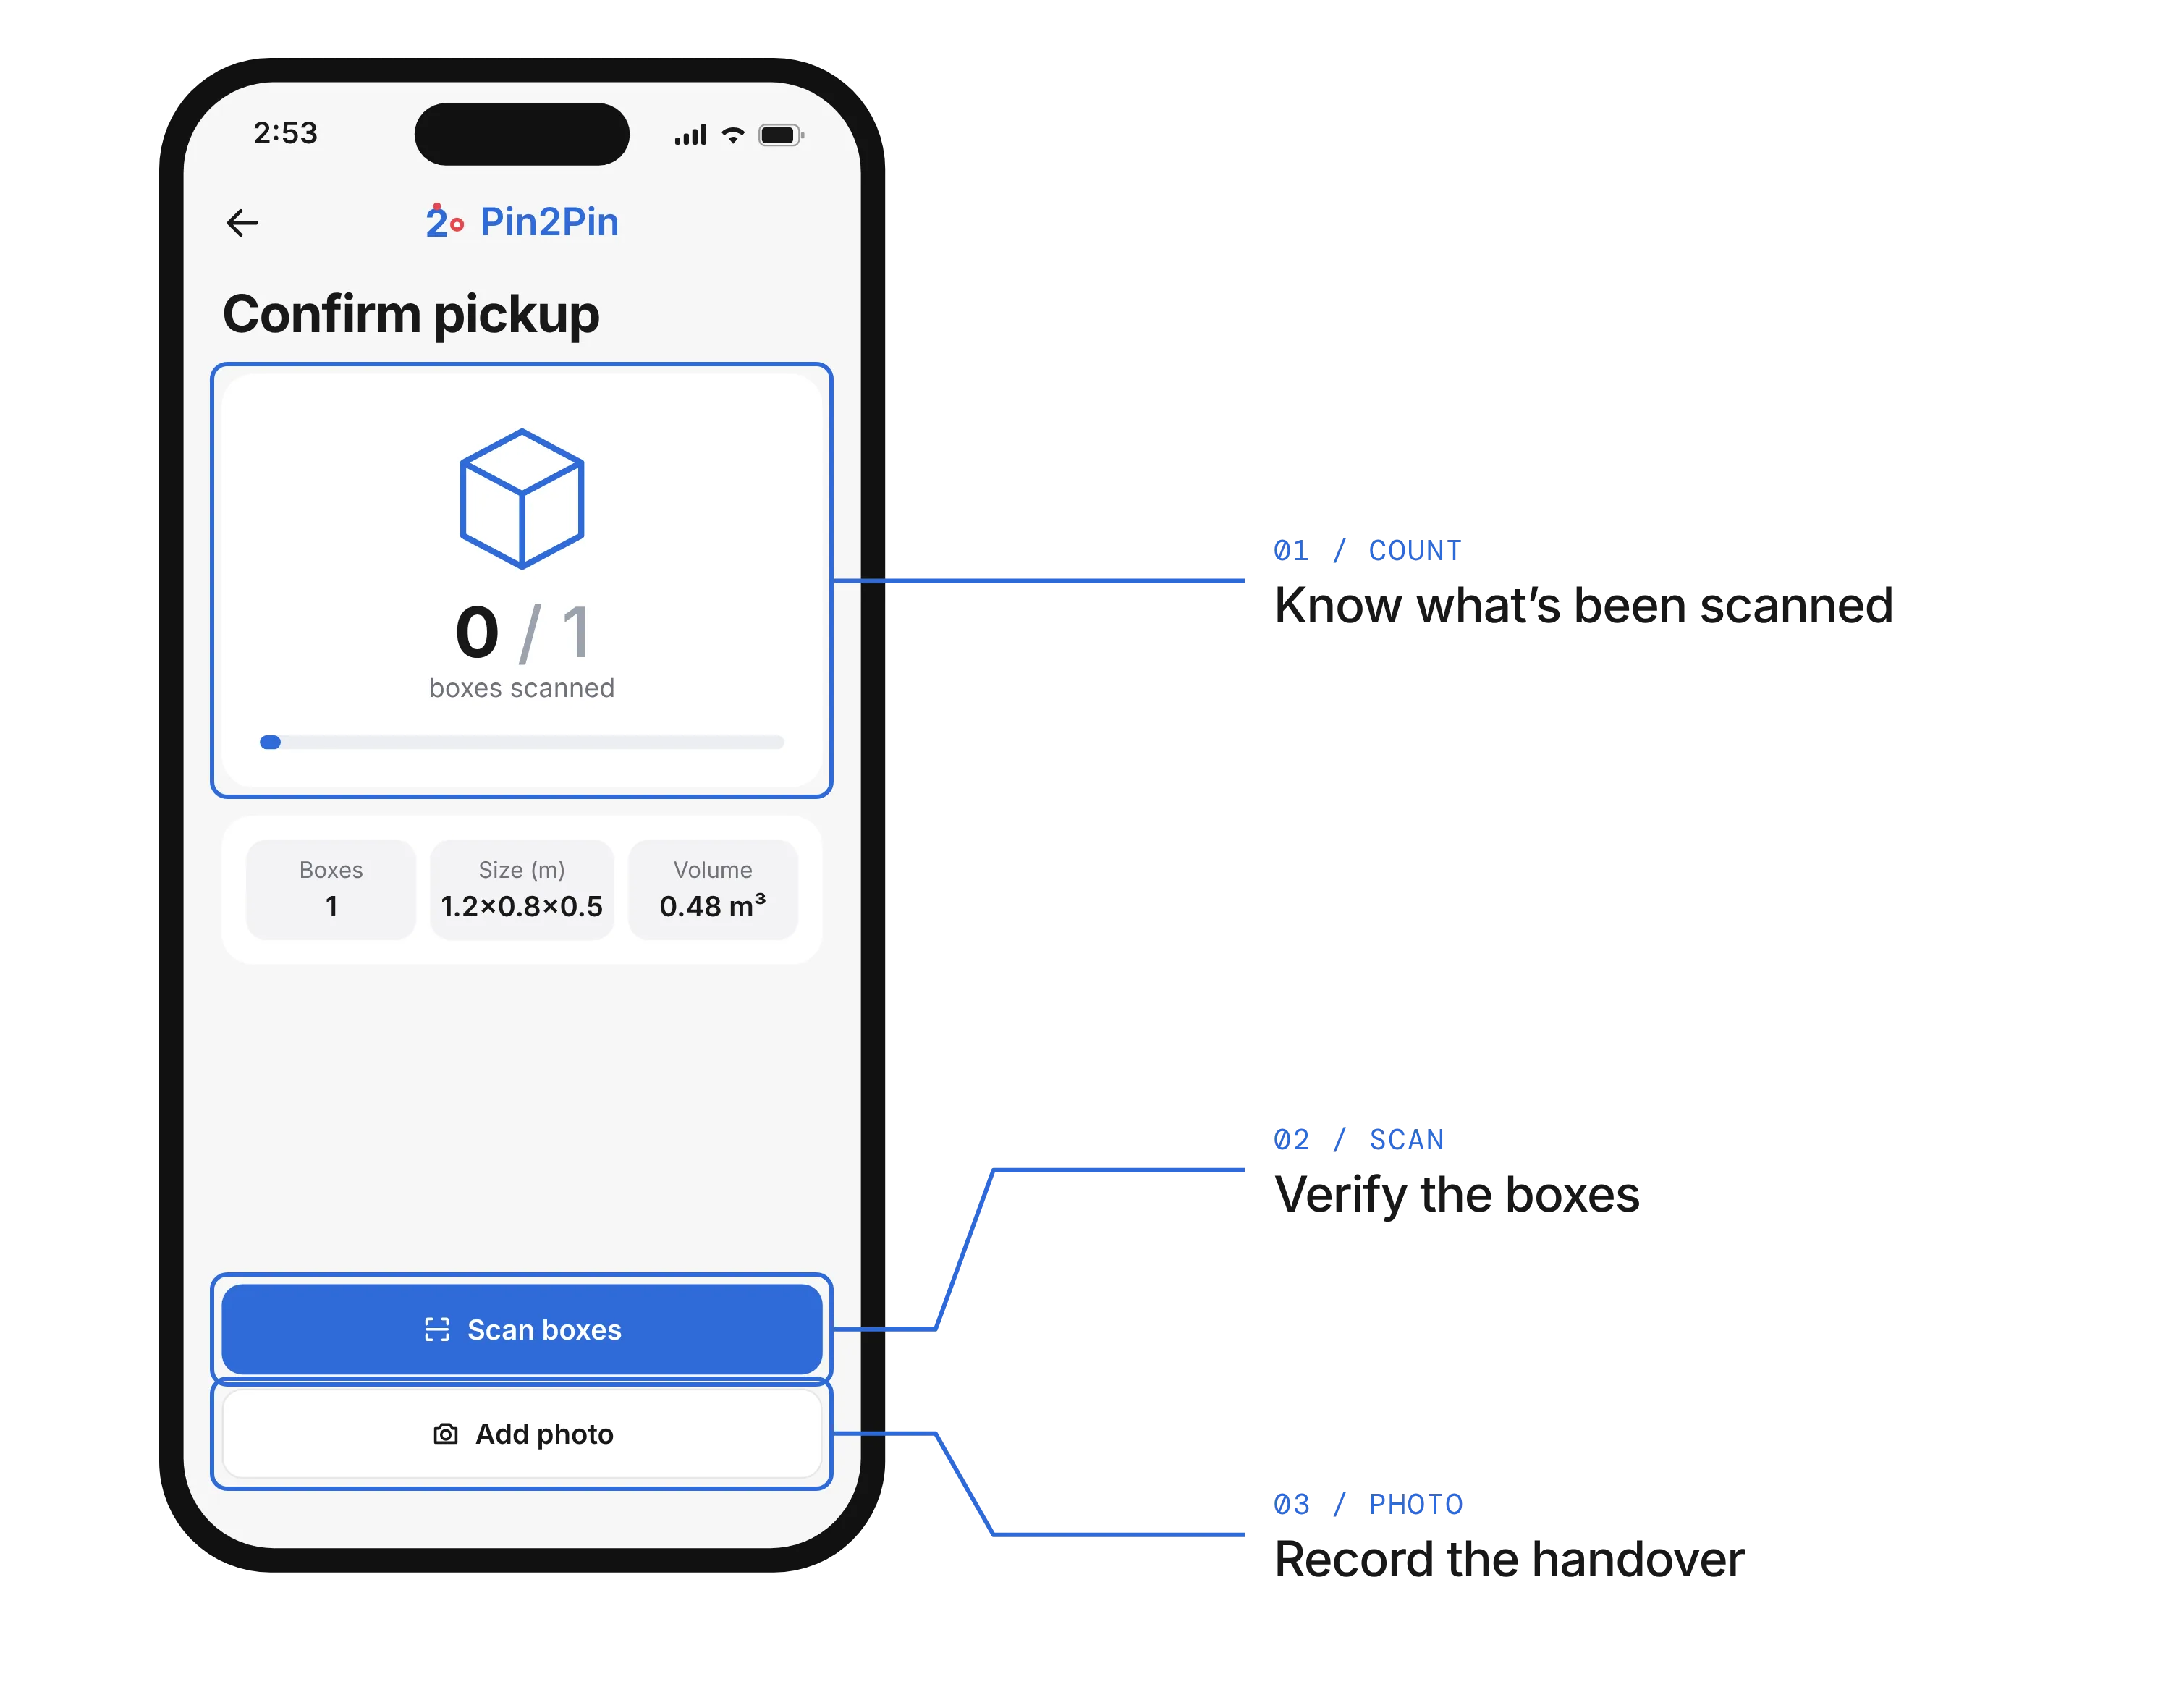
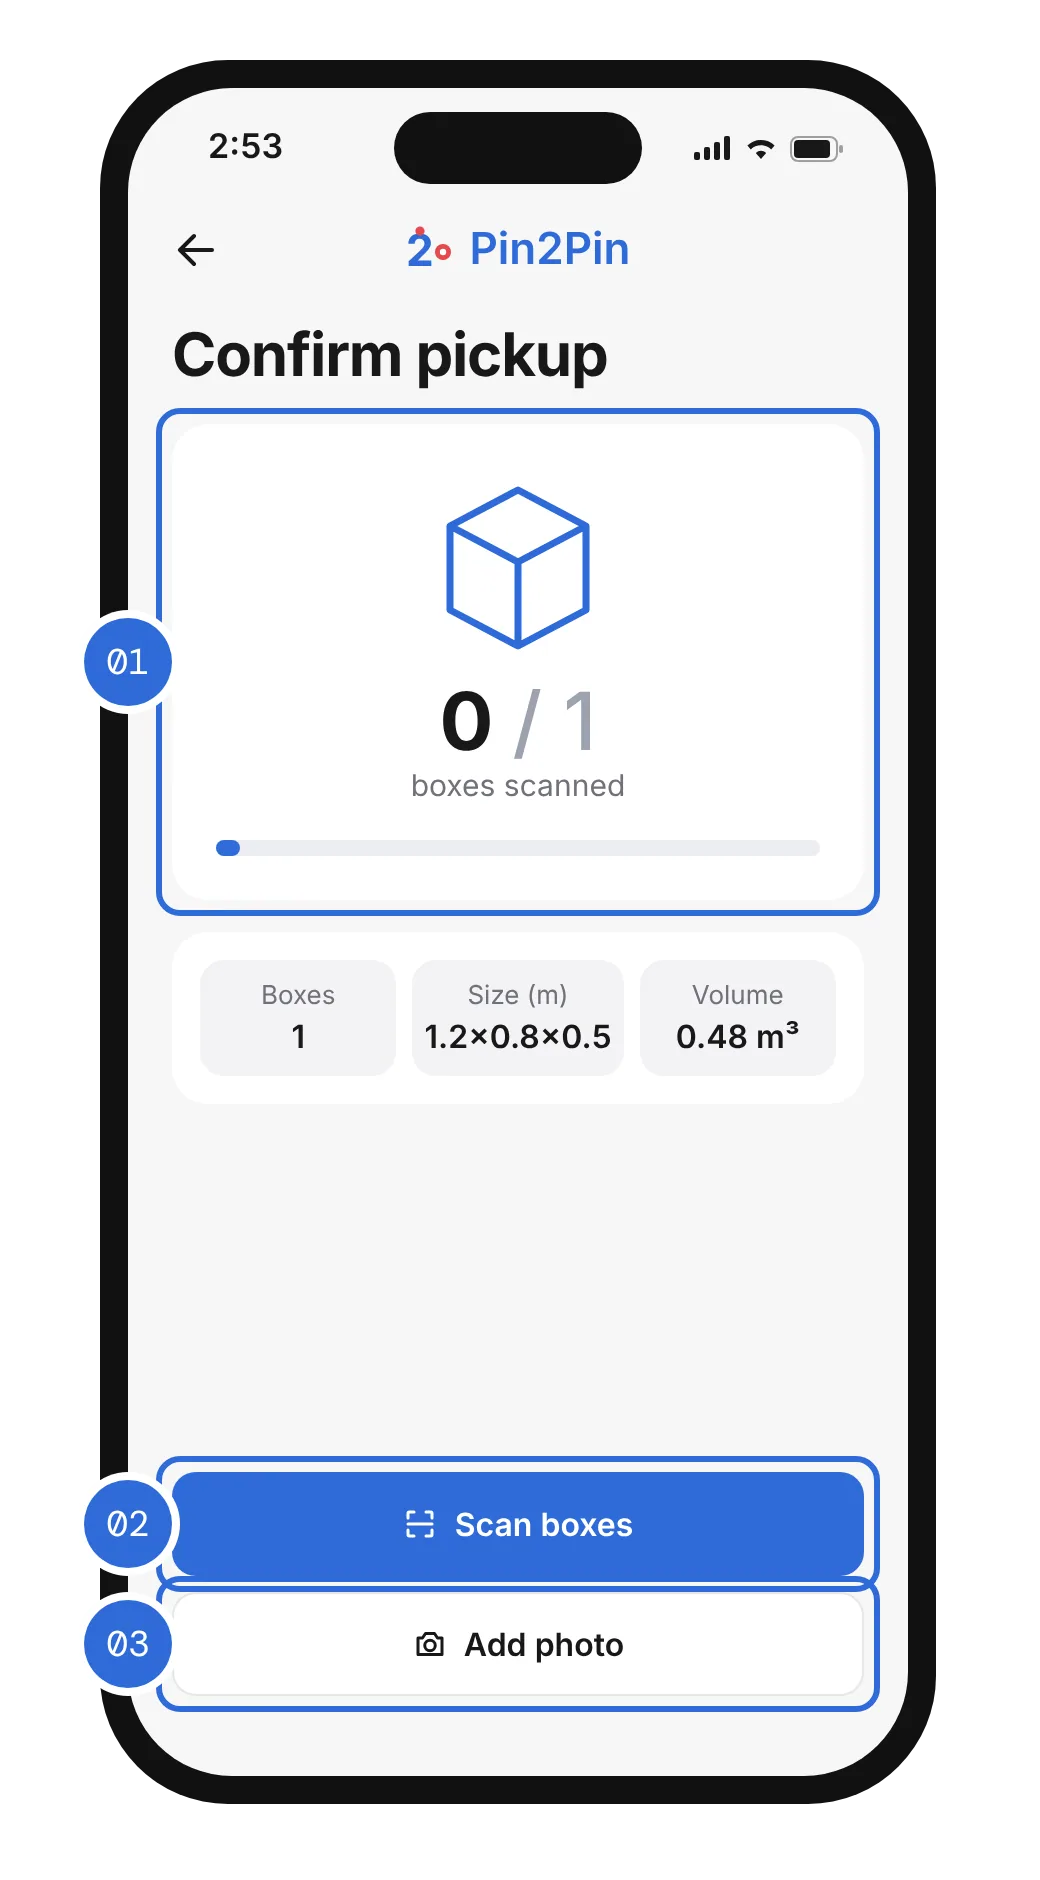
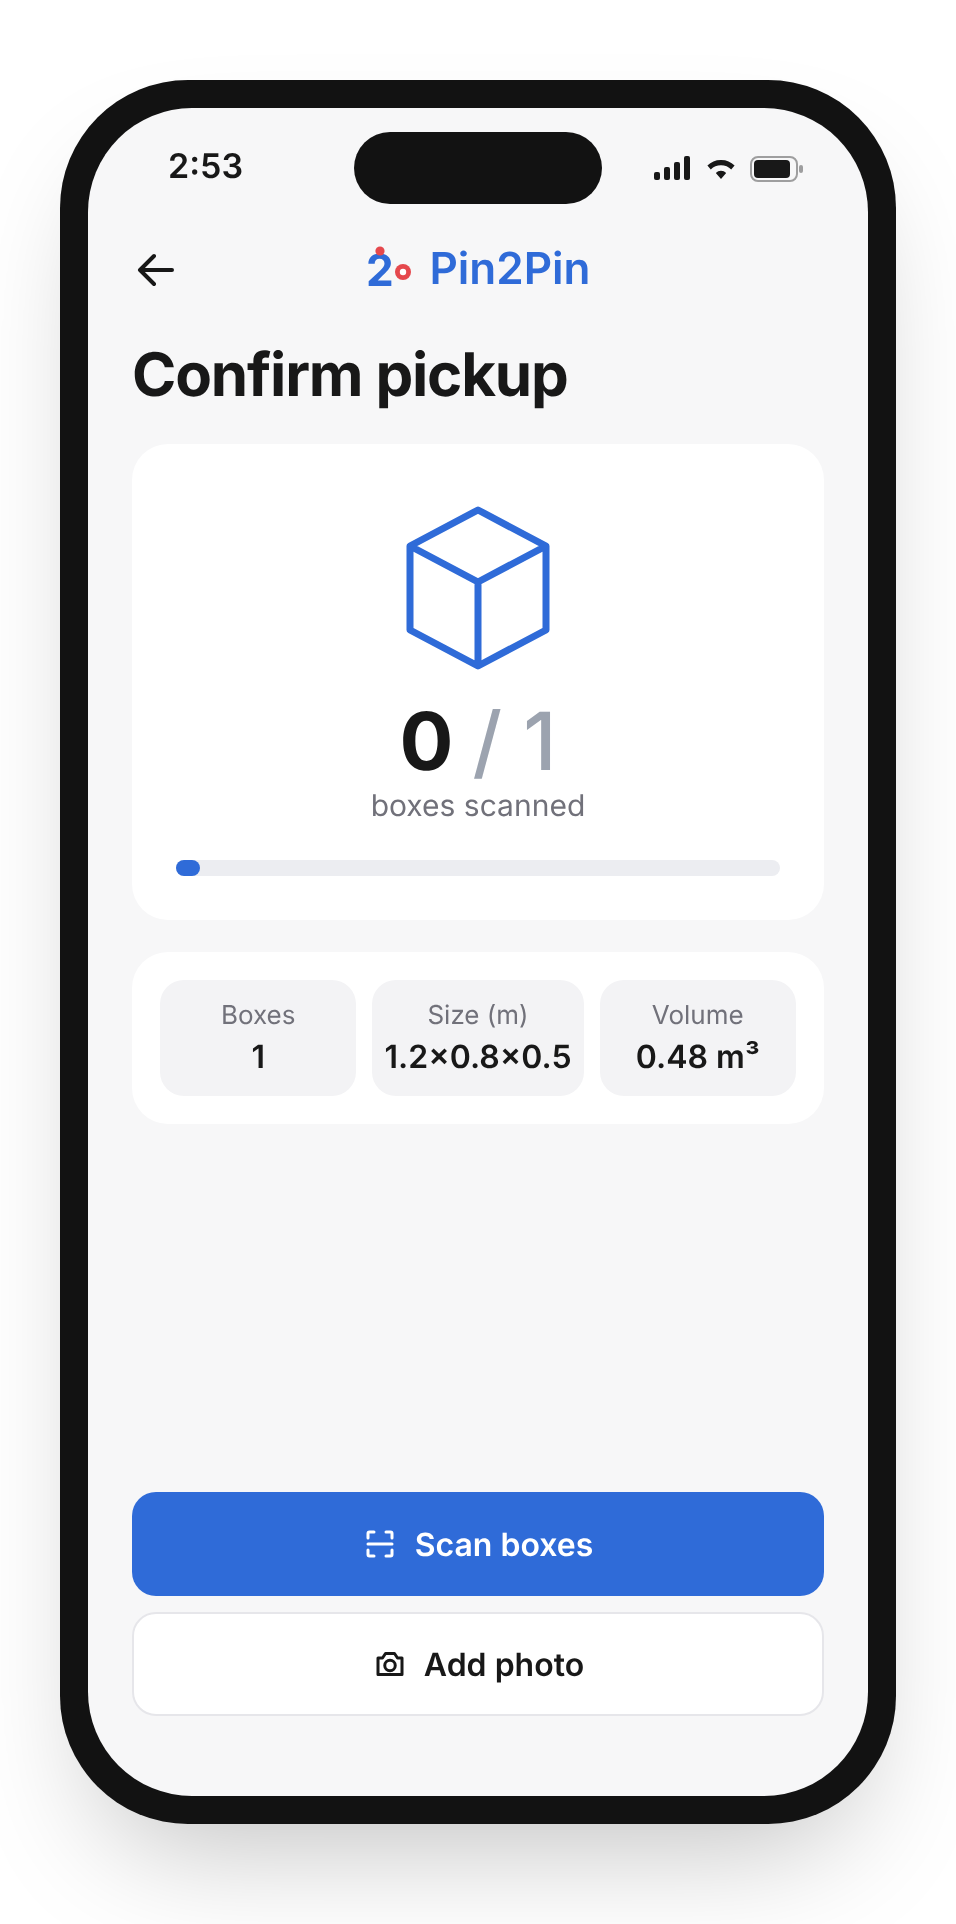
Confirm pickup screen, with three callouts: 01 count, know what’s been scanned; 02 scan, verify the boxes; 03 photo, record the handover
Confirm pickup screen, with 01 the live count, 02 scan and 03 photo marked
  1. CountKnow what’s been scanned
  2. ScanVerify the boxes
  3. PhotoRecord the handover

Scanning and a photo are built into the pickup itself, one tap away, with a live count of boxes scanned. The driver sees when the job is complete; the office gets proof if something goes wrong.

In the office

The office needed answers, not another table.

Without a live view, knowing where an order was meant calling the driver. And in testing, the dashboard was too crowded: the important things competed with detail.

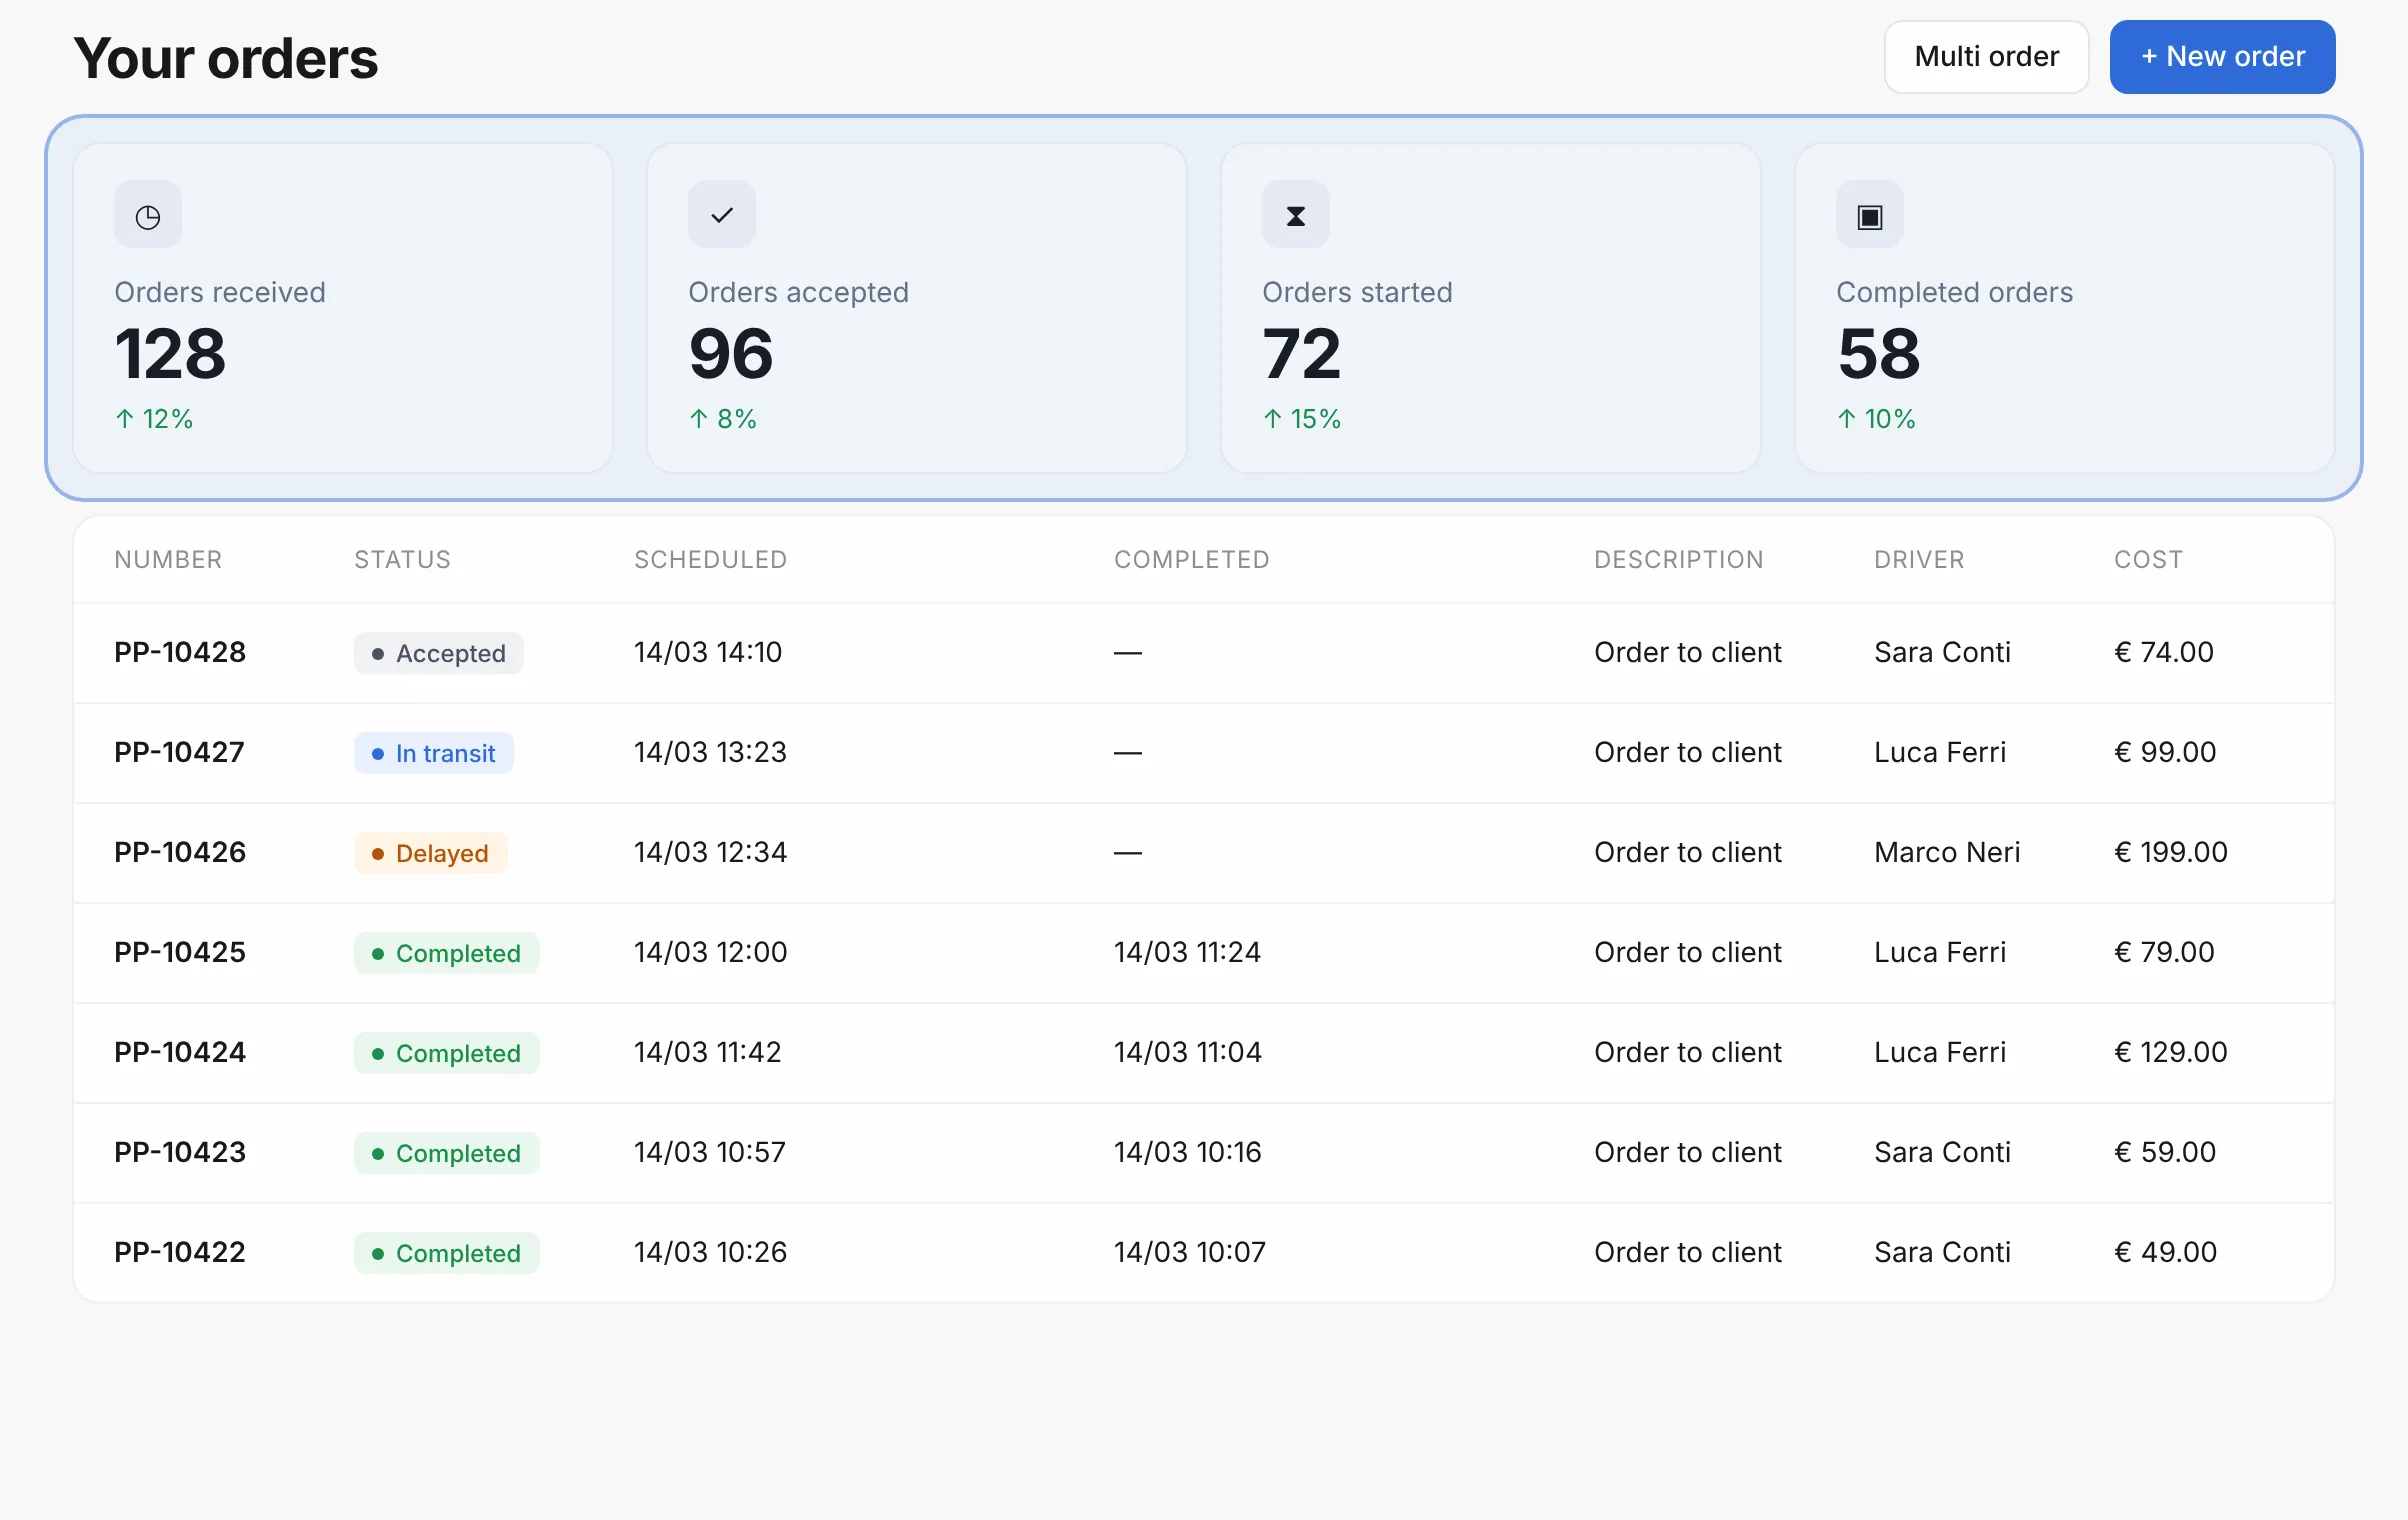
Office dashboard, with a soft highlight around the four order-stage counters above the full list
Office dashboard counters and order list

The dashboard opens on the four stages of an order, received, accepted, started, completed, with the full list below. Four numbers hide detail, so the full list sits directly below them, not on another page: the state of the day comes first, single orders second.
08Final design

One delivery, from pin to pin.

The shipped product, in the order a delivery uses it. A neutral interface, one blue reserved for the main action on each screen, and large type for anything a driver reads while standing.

The office dashboard: four order-stage counters above the full order list
Go to pickup
Order detail with the route
Confirm pickup
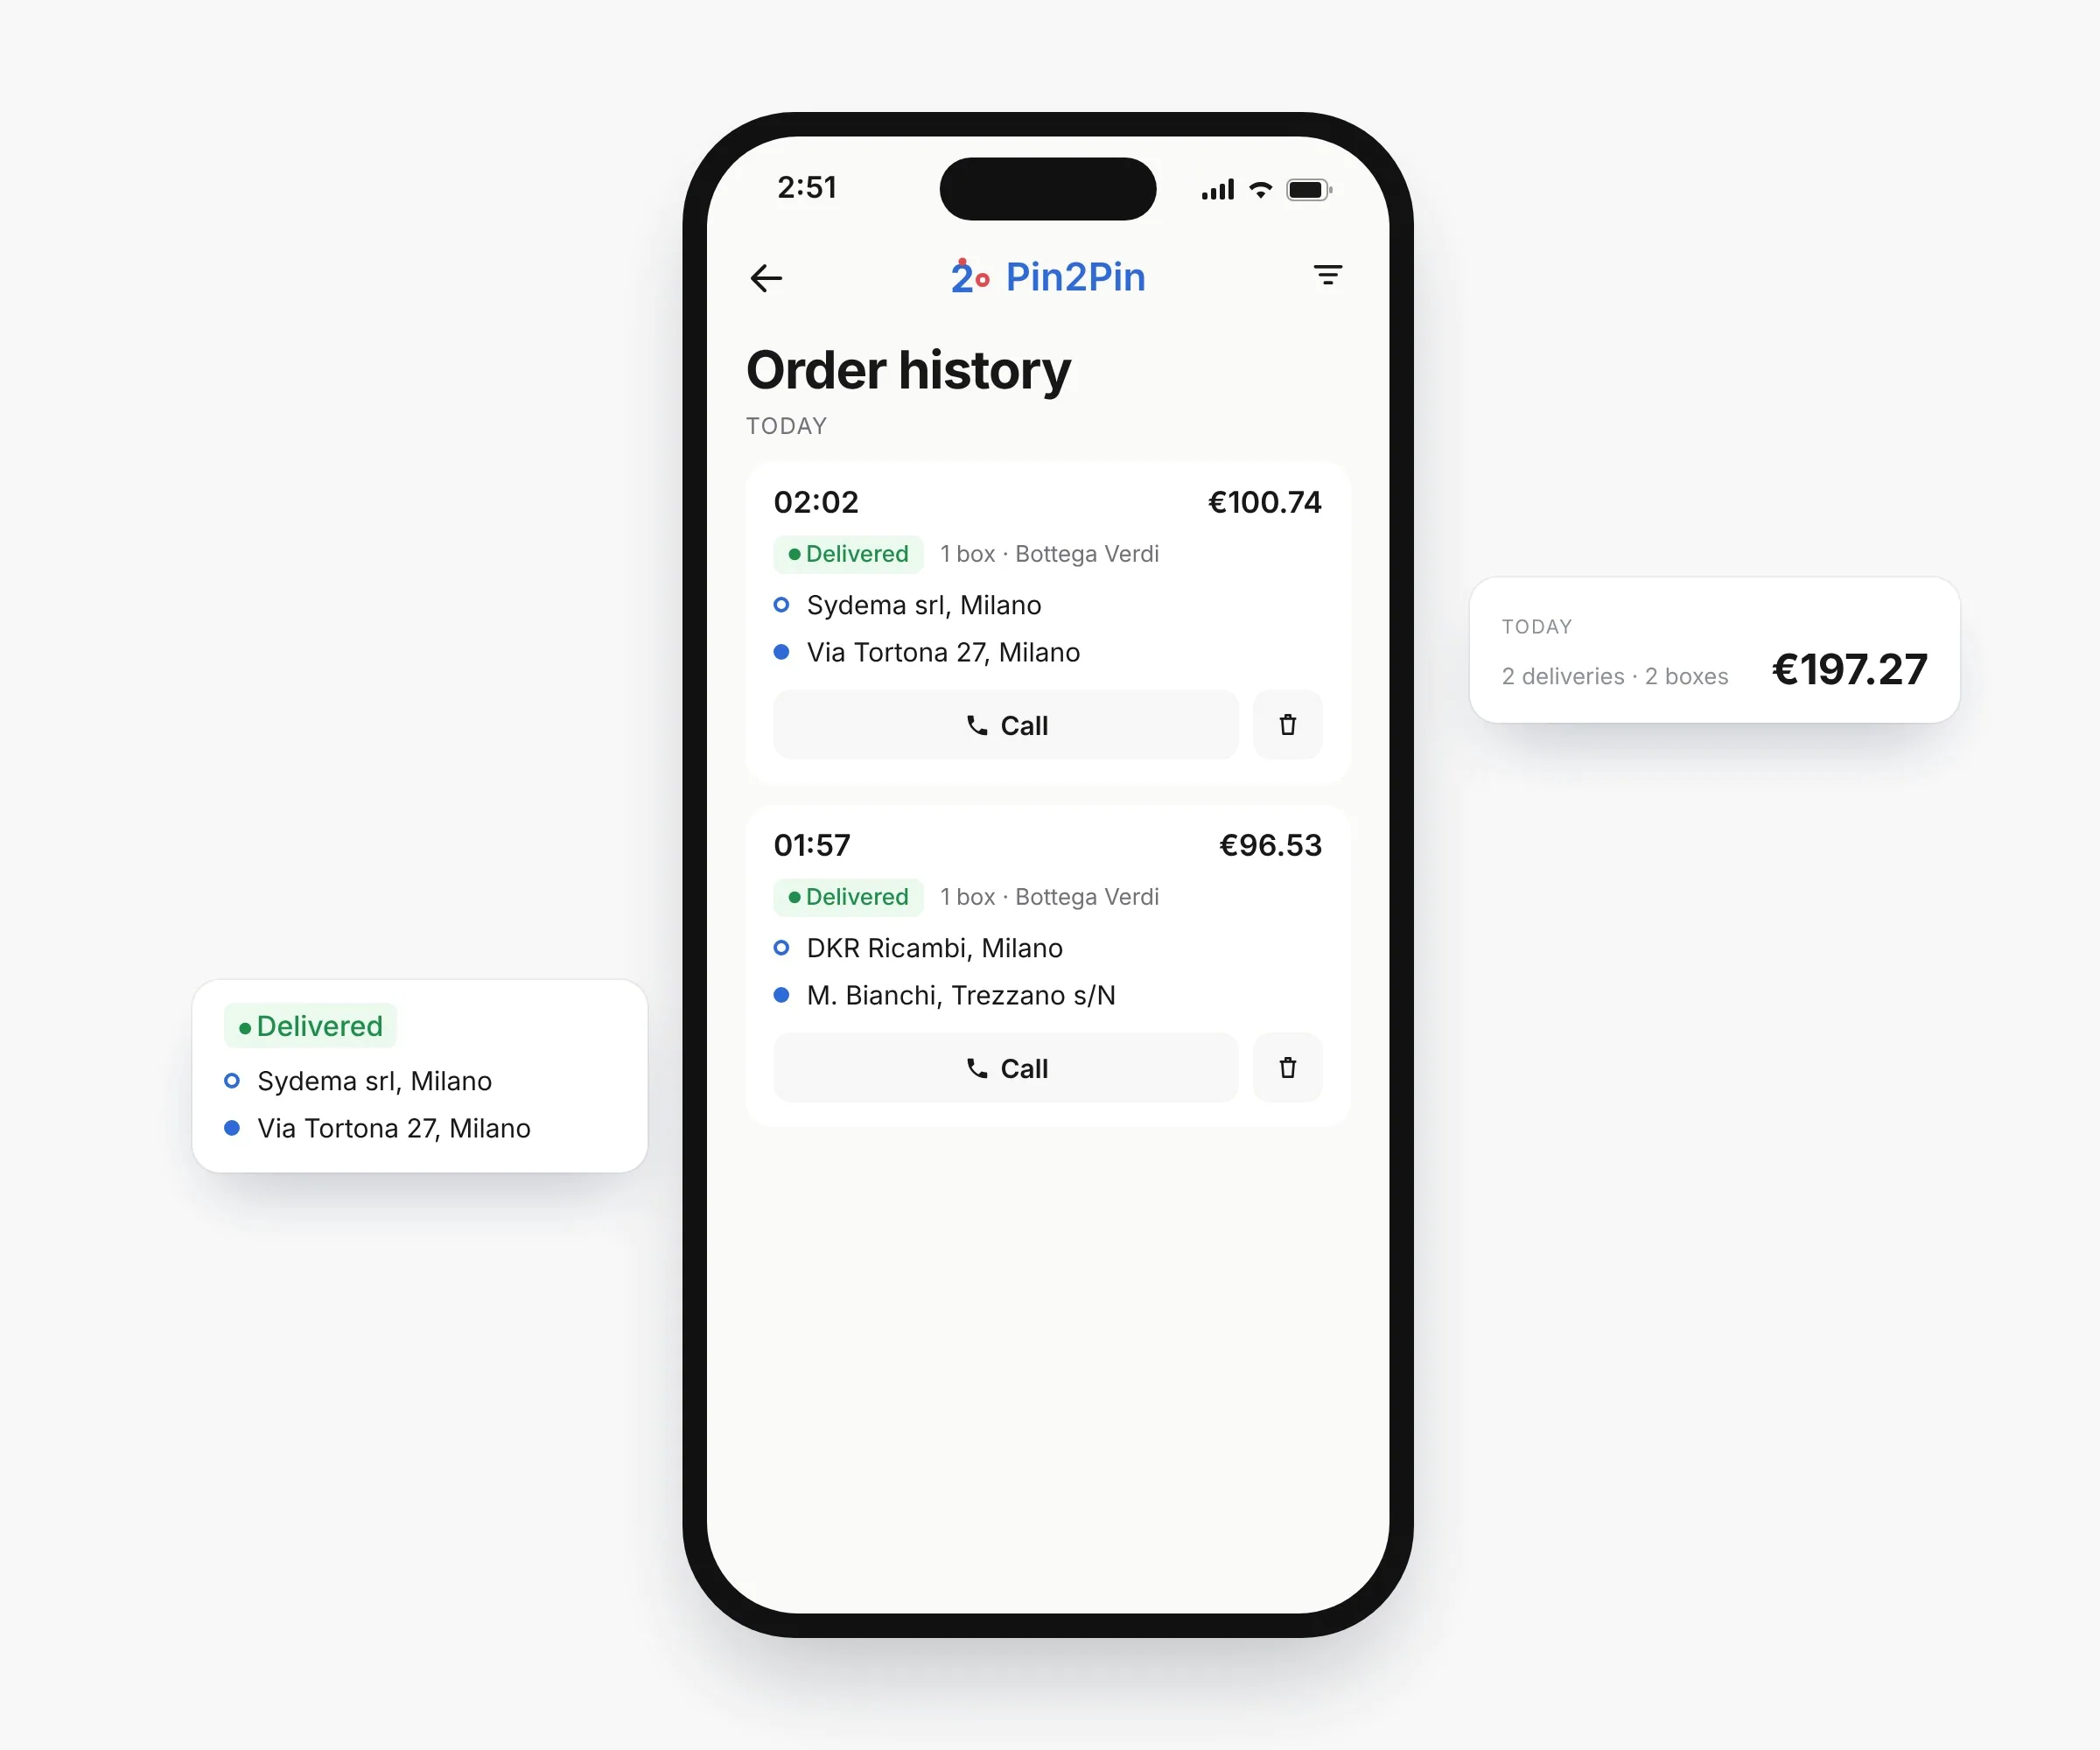
Order history
Driver home with the availability toggle
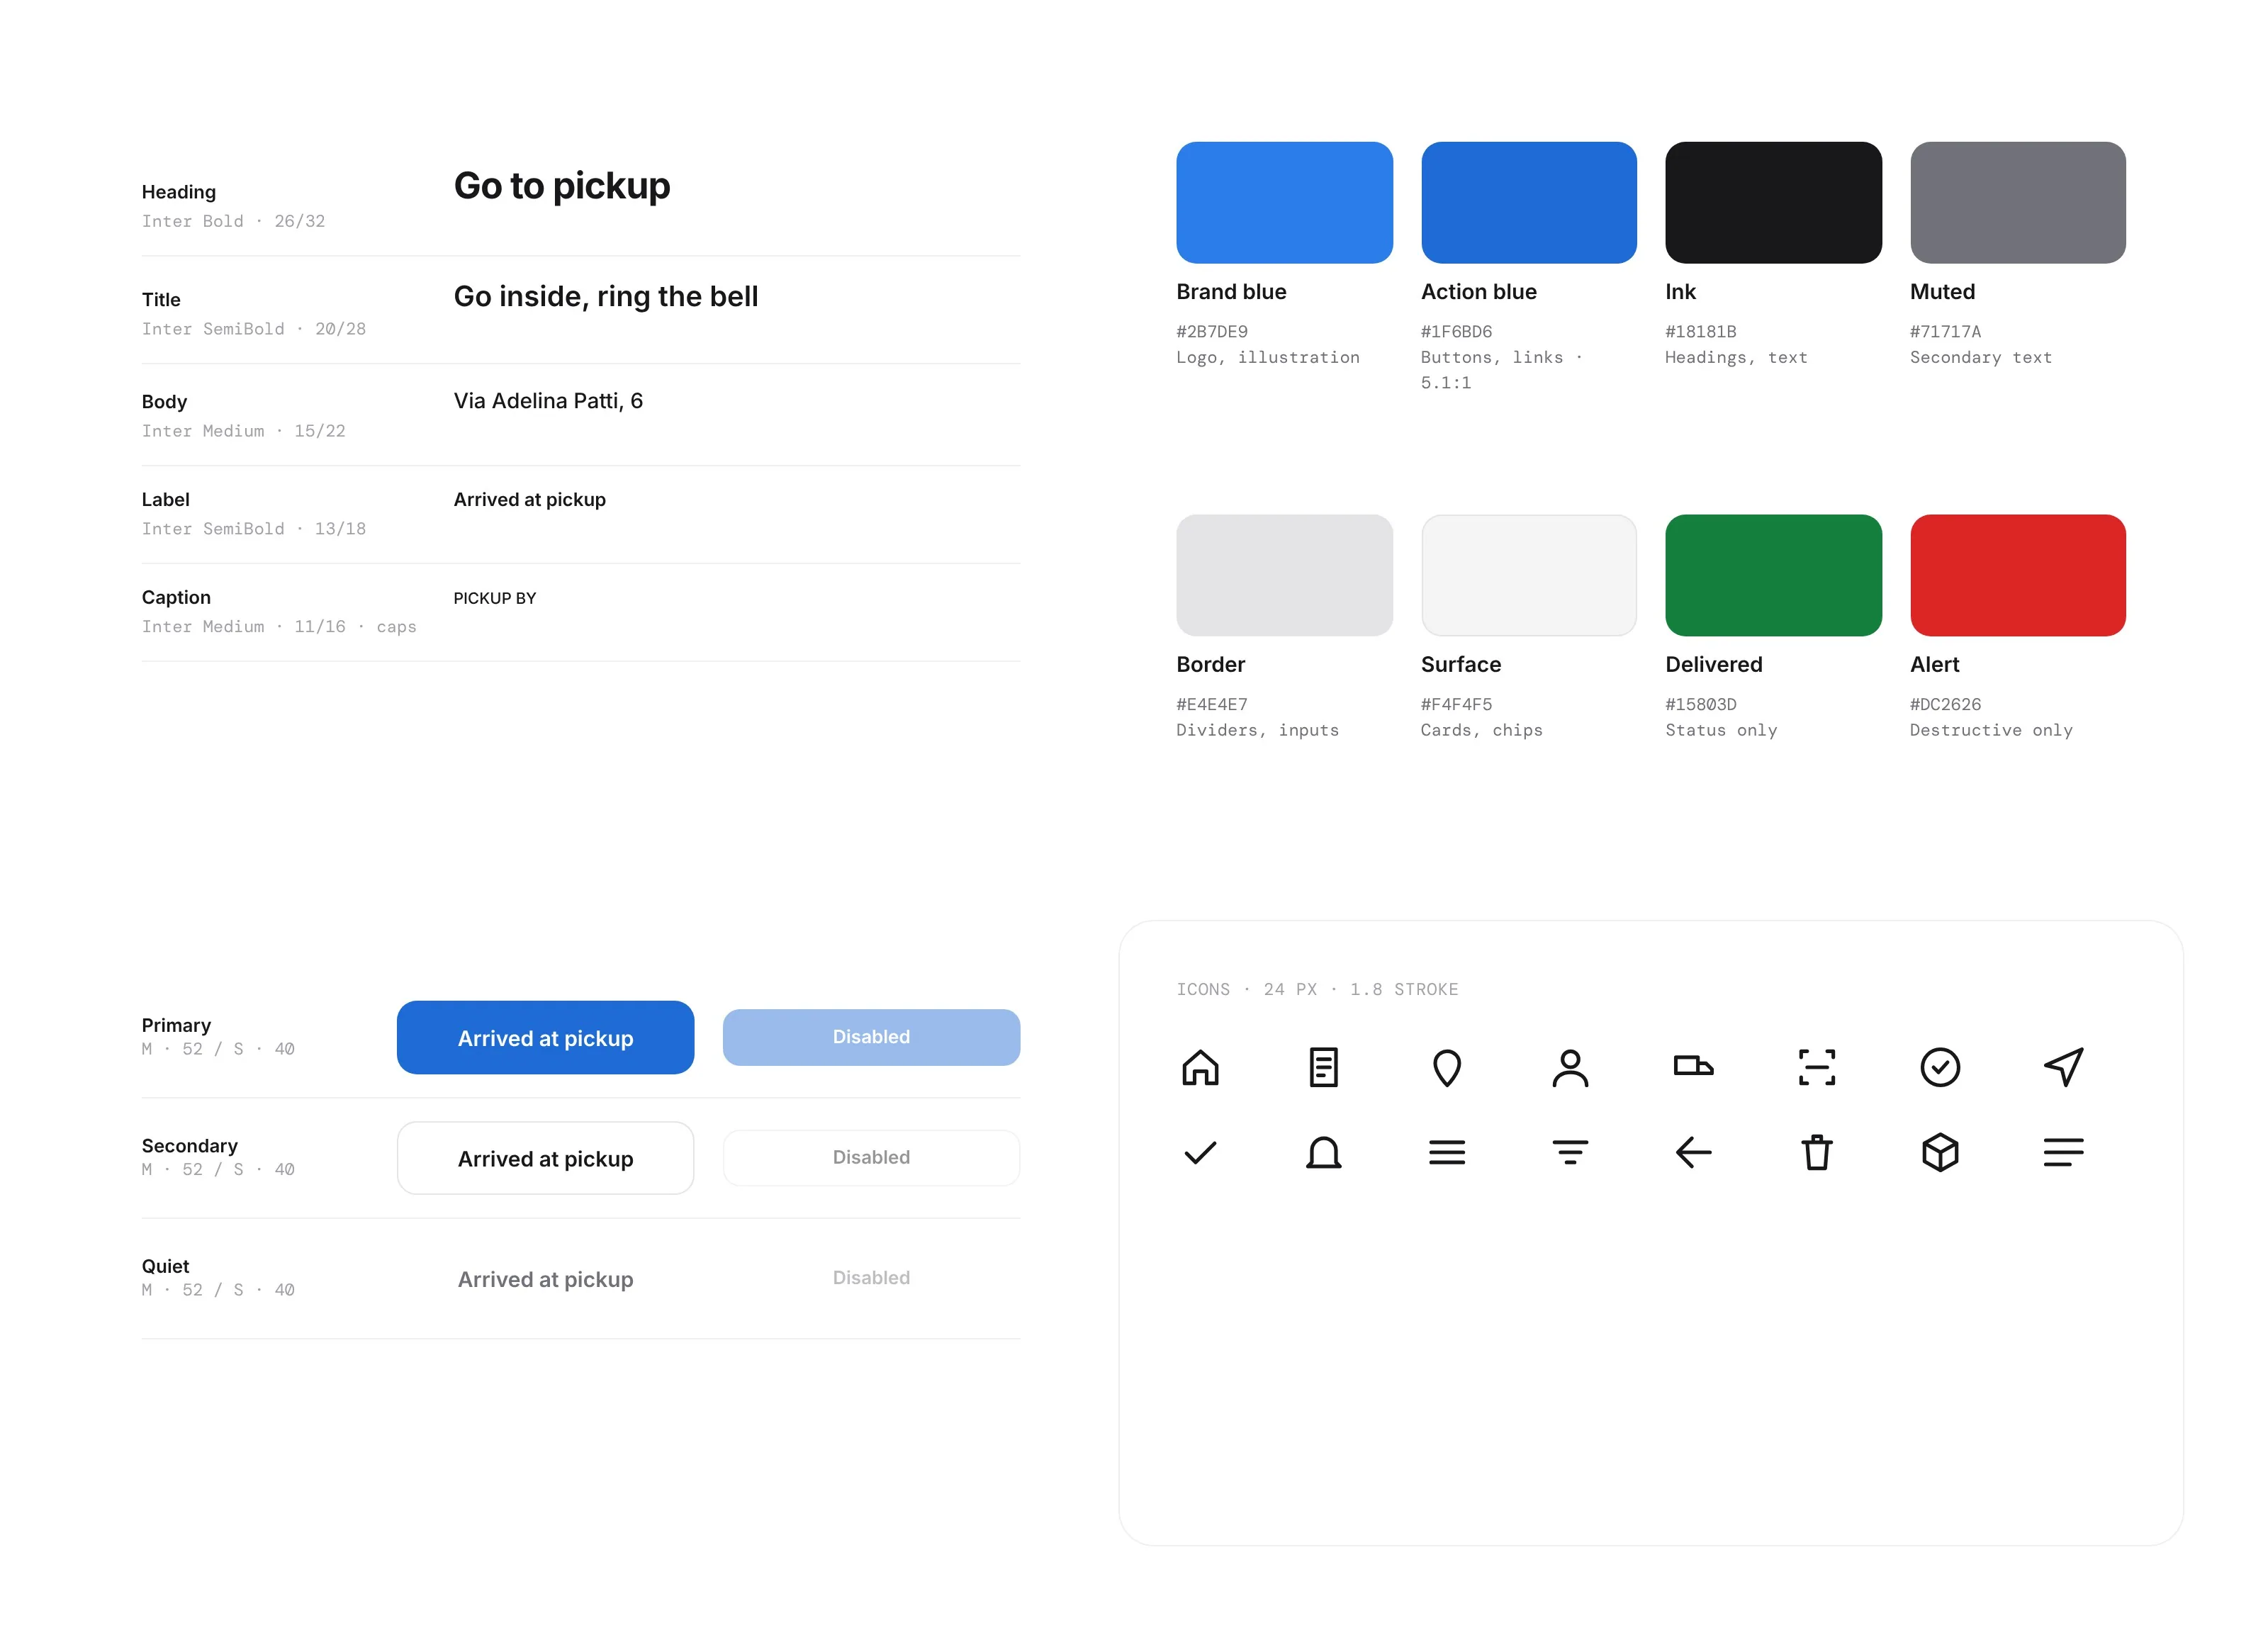
Pin2Pin design system
Design system: one typeface, a neutral scale, brand blue for the mark and a deeper action blue (5.1:1) for buttons and links.

09Outcome

One record of every order, from office to doorstep.

Pin2Pin connected the office and the road through one shared workflow, and kept evolving across releases, shaped by feedback from dispatchers and drivers.

After launch, Log-e reported three changes.

  • −40%

    Status callsThe office could see where an order was instead of phoning the driver.

  • Fewer

    ErrorsEvery handover is now scanned, counted and photographed.

  • Higher

    User satisfactionDispatchers and drivers were more satisfied with the shared workflow.

10Takeaways

In operations, the best screen is the one you don’t need.

Design the handover

Proof belongs inside the flow. Scanning and photos make errors easier to trace, without adding a separate step.

Share the words

When the office and the road use the same names, they can talk about one order without translating.

Next time

Measure the handover

Track scan rates and pickup errors before and after each release.

Test in the van

More sessions in real conditions: one hand, bright sun, a driver in a hurry.

Bring the receiver in

A live tracking link for the customer, so fewer “where is it?” calls.